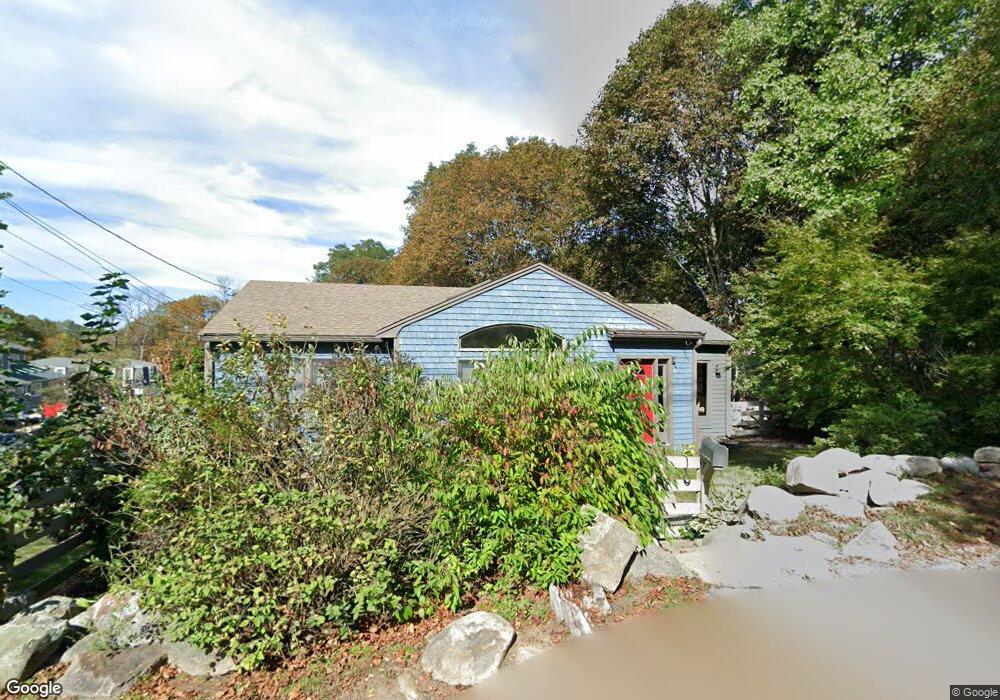
2 Pooles Ln Rockport, MA 01966
Estimated Value: $665,000 - $725,000
3
Beds
2
Baths
1,179
Sq Ft
$597/Sq Ft
Est. Value
About This Home
This home is located at 2 Pooles Ln, Rockport, MA 01966 and is currently estimated at $703,432, approximately $596 per square foot. 2 Pooles Ln is a home located in Essex County with nearby schools including Rockport Elementary School, Rockport Middle School, and Rockport High School.
Ownership History
Date
Name
Owned For
Owner Type
Purchase Details
Closed on
Jun 20, 2005
Sold by
Wonson Dianne L and Wonson John F
Bought by
Spector David B
Current Estimated Value
Purchase Details
Closed on
Jun 7, 2002
Sold by
Ingersoll Timothy S
Bought by
Helfant David B and Helfant Heather J
Purchase Details
Closed on
Mar 16, 2001
Sold by
Pohas Rt and Pohas
Bought by
Ingersoll Timothy S
Create a Home Valuation Report for This Property
The Home Valuation Report is an in-depth analysis detailing your home's value as well as a comparison with similar homes in the area
Home Values in the Area
Average Home Value in this Area
Purchase History
| Date | Buyer | Sale Price | Title Company |
|---|---|---|---|
| Spector David B | $382,000 | -- | |
| Spector David B | $382,000 | -- | |
| Helfant David B | $190,000 | -- | |
| Helfant David B | $190,000 | -- | |
| Ingersoll Timothy S | $75,000 | -- | |
| Ingersoll Timothy S | $75,000 | -- |
Source: Public Records
Mortgage History
| Date | Status | Borrower | Loan Amount |
|---|---|---|---|
| Previous Owner | Ingersoll Timothy S | $255,000 | |
| Previous Owner | Ingersoll Timothy S | $100,000 |
Source: Public Records
Tax History
| Year | Tax Paid | Tax Assessment Tax Assessment Total Assessment is a certain percentage of the fair market value that is determined by local assessors to be the total taxable value of land and additions on the property. | Land | Improvement |
|---|---|---|---|---|
| 2025 | $4,964 | $566,700 | $316,600 | $250,100 |
| 2024 | $4,644 | $551,600 | $301,500 | $250,100 |
| 2023 | $4,423 | $469,000 | $251,300 | $217,700 |
| 2022 | $4,784 | $487,200 | $223,400 | $263,800 |
| 2021 | $4,584 | $470,600 | $212,700 | $257,900 |
| 2020 | $4,007 | $396,700 | $202,600 | $194,100 |
| 2019 | $3,755 | $380,800 | $197,500 | $183,300 |
| 2018 | $3,657 | $361,700 | $197,500 | $164,200 |
| 2017 | $3,518 | $311,900 | $179,100 | $132,800 |
| 2016 | $3,495 | $310,700 | $174,100 | $136,600 |
| 2015 | $3,405 | $309,500 | $174,100 | $135,400 |
| 2014 | $3,211 | $284,900 | $156,700 | $128,200 |
Source: Public Records
Map
Nearby Homes
- 1 Charte Ct
- 177 Main St
- 1 Jewett St Unit 2
- 5 Smith St Unit R
- 1 Main St Unit R
- 1 Main St Unit C
- 34R Summer St
- 4 Norwood Ave
- 27 Hodgkins Rd
- 33 Quarry Ridge Ln Unit 33
- 5 Boulder Top
- 33 Highview Rd
- 175 South St
- 148 Long Beach
- 48 Eden Rd
- 13 Phillips Ave
- 32 Witham St Unit B
- 70 Old Nugent Farm Rd
- 78 Thatcher Rd Unit 6
- 32 Haven Ave
Your Personal Tour Guide
Ask me questions while you tour the home.