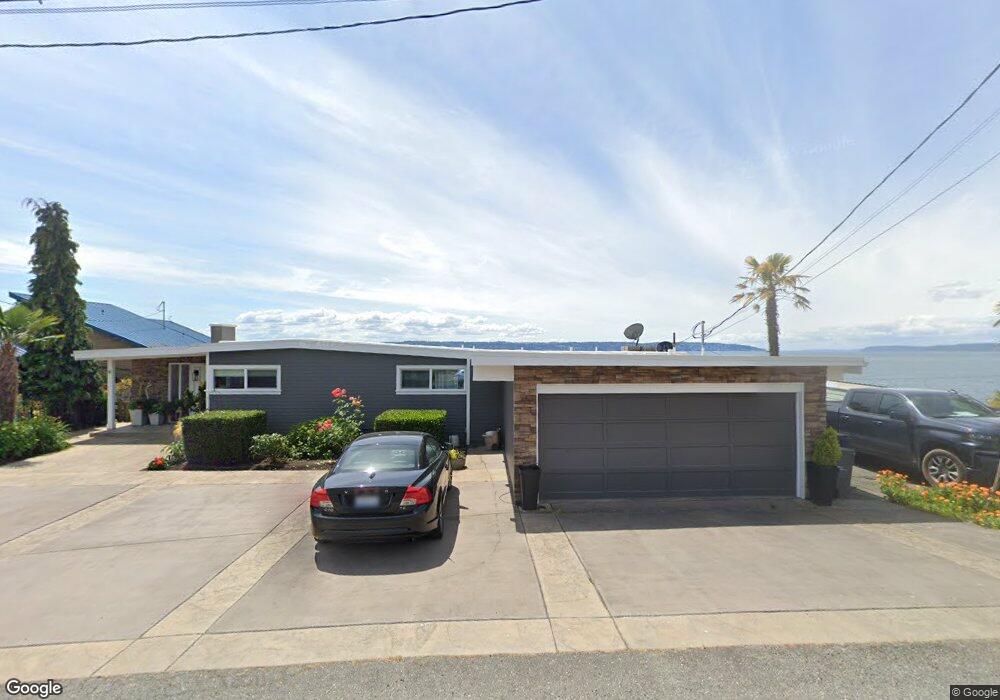
2 Priest Point Dr NE Tulalip, WA 98271
Estimated Value: $957,000 - $1,188,769
3
Beds
2
Baths
1,708
Sq Ft
$627/Sq Ft
Est. Value
About This Home
This home is located at 2 Priest Point Dr NE, Tulalip, WA 98271 and is currently estimated at $1,070,942, approximately $627 per square foot. 2 Priest Point Dr NE is a home located in Snohomish County.
Ownership History
Date
Name
Owned For
Owner Type
Purchase Details
Closed on
Dec 29, 2017
Sold by
Cook Patrick V
Bought by
Cook Amy Beth
Current Estimated Value
Purchase Details
Closed on
Apr 13, 2005
Sold by
Gullikson John S and John S Gullikson Qualified Per
Bought by
Kollmeyer Nancy and Villella Anne
Purchase Details
Closed on
Apr 1, 1998
Sold by
Gullikson John S and Gullikson Virginia C
Bought by
Gullikson John S
Purchase Details
Closed on
Oct 27, 1993
Sold by
Buell Mary E
Bought by
Grant Philip D and Grant Ruth T
Create a Home Valuation Report for This Property
The Home Valuation Report is an in-depth analysis detailing your home's value as well as a comparison with similar homes in the area
Home Values in the Area
Average Home Value in this Area
Purchase History
| Date | Buyer | Sale Price | Title Company |
|---|---|---|---|
| Cook Amy Beth | -- | None Available | |
| Kollmeyer Nancy | -- | -- | |
| Gullikson John S | -- | -- | |
| Grant Philip D | -- | Stewart Title Company Of Sno |
Source: Public Records
Tax History Compared to Growth
Tax History
| Year | Tax Paid | Tax Assessment Tax Assessment Total Assessment is a certain percentage of the fair market value that is determined by local assessors to be the total taxable value of land and additions on the property. | Land | Improvement |
|---|---|---|---|---|
| 2025 | $9,299 | $1,196,200 | $910,600 | $285,600 |
| 2024 | $9,299 | $1,144,200 | $876,500 | $267,700 |
| 2023 | $7,256 | $1,190,900 | $891,100 | $299,800 |
| 2022 | $9,778 | $949,500 | $708,500 | $241,000 |
| 2020 | $8,641 | $769,200 | $562,400 | $206,800 |
| 2019 | $6,950 | $708,300 | $513,700 | $194,600 |
| 2018 | $7,134 | $581,700 | $445,500 | $136,200 |
| 2017 | $7,113 | $589,800 | $465,000 | $124,800 |
| 2016 | $7,122 | $566,700 | $446,400 | $120,300 |
| 2015 | $7,488 | $551,100 | $446,400 | $104,700 |
| 2013 | $6,991 | $498,100 | $400,800 | $97,300 |
Source: Public Records
Map
Nearby Homes
- 4019 Priest Point Dr NE
- 4425 Meridian Ave N Unit 12
- 0 Tulalip Rd
- 524 Wetmore Ave
- 721 Rucker Ave
- 811 Rucker Ave
- 1010 Hoyt Ave Unit A-2
- 708 Waverly Ave
- 2828 Mission Beach Heights Rd
- 2408 6th St
- 429 Legion Dr
- 501 Legion Dr Unit B
- 2010 10th St
- 1711 12th St Unit A
- 2800 35th Ave NE
- 3401 N Broadway
- 510 Pilchuck Path Unit W2
- 2501 W Marine View Dr
- 1602 Rucker Ave
- 3409 Mission Beach Rd
- 8 Priest Point Dr NE
- 3829 Meridian Ave N
- 20 Priest Point Dr NE
- 3818 Meridian Ave N
- 3901 Meridian Ave N
- 24 Priest Point Dr NE
- 28 Priest Point Dr NE
- 30 Priest Point Dr NW
- 3909 Meridian Ave N
- 104 Priest Point Dr NW
- 12 Priest Point Dr NE
- 100 Priest Point Dr NE
- 3913 Meridian Ave N
- 44 Priest Point Dr NW
- 3919 Meridian Ave N
- 102 Priest Point Dr NE
- 108 Priest Point Dr NE
- 112 Priest Point Dr NW
- 3920 Meridian Ave N