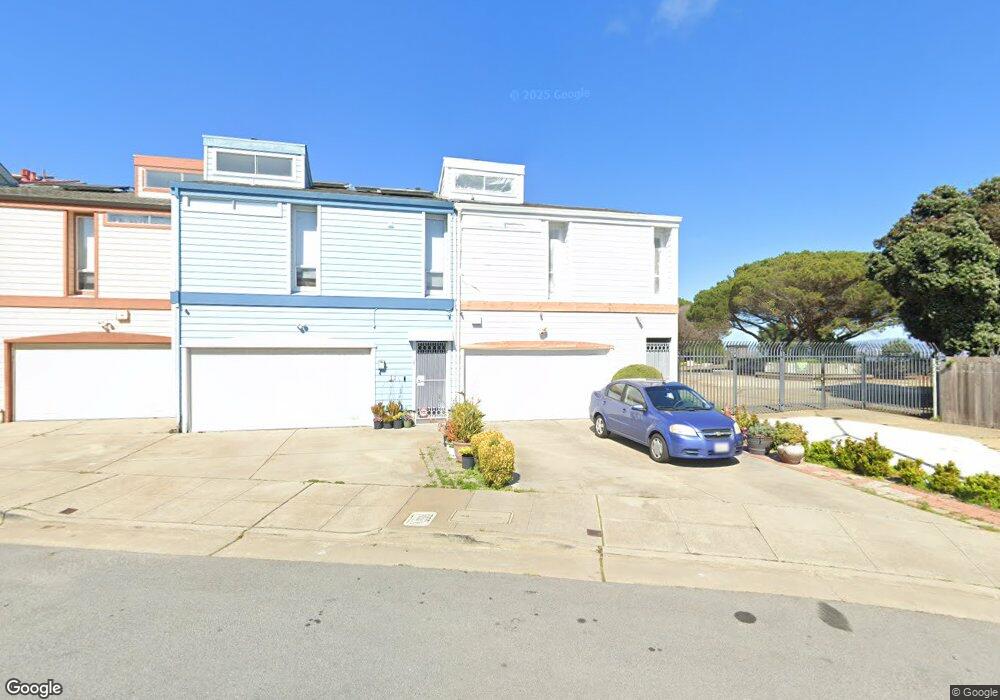
2 Progress St San Francisco, CA 94124
Bayview NeighborhoodEstimated Value: $914,000 - $1,001,000
3
Beds
2
Baths
1,583
Sq Ft
$602/Sq Ft
Est. Value
About This Home
This home is located at 2 Progress St, San Francisco, CA 94124 and is currently estimated at $952,415, approximately $601 per square foot. 2 Progress St is a home located in San Francisco County with nearby schools including Carver (George Washington) Elementary School, Willie L. Brown Jr. Middle School, and KIPP Bayview Academy.
Ownership History
Date
Name
Owned For
Owner Type
Purchase Details
Closed on
Oct 3, 2003
Sold by
Thibodeaux George
Bought by
Thibodeaux George and Thibodeaux Joann
Current Estimated Value
Purchase Details
Closed on
May 23, 2003
Sold by
Thibodeaux Joann
Bought by
Thibodeaux George
Home Financials for this Owner
Home Financials are based on the most recent Mortgage that was taken out on this home.
Original Mortgage
$191,500
Outstanding Balance
$80,010
Interest Rate
5.26%
Mortgage Type
Purchase Money Mortgage
Estimated Equity
$872,405
Purchase Details
Closed on
Jul 23, 1998
Sold by
Tessaire Thomas and Thomas Gant Tessaire
Bought by
Thibodeaux George and Thibodeaux Joann
Home Financials for this Owner
Home Financials are based on the most recent Mortgage that was taken out on this home.
Original Mortgage
$199,500
Interest Rate
6.91%
Create a Home Valuation Report for This Property
The Home Valuation Report is an in-depth analysis detailing your home's value as well as a comparison with similar homes in the area
Home Values in the Area
Average Home Value in this Area
Purchase History
| Date | Buyer | Sale Price | Title Company |
|---|---|---|---|
| Thibodeaux George | -- | First American Title Ins Co | |
| Thibodeaux George | -- | First American Title Company | |
| Thibodeaux George | $210,000 | Fidelity National Title Co | |
| Thomas Gant Tassaire | -- | Fidelity National Title Co |
Source: Public Records
Mortgage History
| Date | Status | Borrower | Loan Amount |
|---|---|---|---|
| Open | Thibodeaux George | $191,500 | |
| Closed | Thibodeaux George | $199,500 |
Source: Public Records
Tax History Compared to Growth
Tax History
| Year | Tax Paid | Tax Assessment Tax Assessment Total Assessment is a certain percentage of the fair market value that is determined by local assessors to be the total taxable value of land and additions on the property. | Land | Improvement |
|---|---|---|---|---|
| 2025 | $6,560 | $568,676 | $341,210 | $227,466 |
| 2024 | $6,560 | $557,526 | $334,520 | $223,006 |
| 2023 | $6,466 | $546,596 | $327,962 | $218,634 |
| 2022 | $6,350 | $535,880 | $321,532 | $214,348 |
| 2021 | $6,241 | $525,374 | $315,228 | $210,146 |
| 2020 | $6,259 | $519,988 | $311,996 | $207,992 |
| 2019 | $6,044 | $509,794 | $305,880 | $203,914 |
| 2018 | $5,842 | $499,800 | $299,884 | $199,916 |
| 2017 | $5,773 | $490,002 | $294,004 | $195,998 |
| 2016 | $5,661 | $480,396 | $288,240 | $192,156 |
| 2015 | $5,592 | $473,182 | $283,912 | $189,270 |
| 2014 | $5,445 | $463,916 | $278,352 | $185,564 |
Source: Public Records
Map
Nearby Homes
- 19 Progress St
- 0 Ship St Unit HD24144152
- 0 Ship St Unit HD24144130
- 0 Ship St Unit HD24144117
- 0 Ship St Unit HD24144142
- 1411 Oakdale Ave
- 1484 Newcomb Ave
- 1379-1381 Palou Ave
- 818 Innes Ave
- 1143 Palou Ave
- 983 Innes Ave
- 59 Kiska Rd
- 1531 Jerrold Ave
- 1414 Shafter Ave
- 1537 Revere Ave
- 1463 Thomas Ave
- 1278 Thomas Ave
- 1942 Jennings St
- 1539 Oakdale Ave
- 1590 Underwood Ave
- 8 Progress St
- 16 Progress St
- 24 Progress St
- 32 Progress St
- 64 Whitney Young Cir
- 62 Whitney Young Cir
- 1 Progress St
- 7 Progress St
- 15 Progress St
- 60 Whitney Young Cir
- 58 Whitney Young Cir
- 25 Progress St
- 56 Whitney Young Cir
- 33 Progress St
- 54 Whitney Young Cir
- 39 Progress St
- 52 Whitney Young Cir
- 45 Progress St
- 57 Progress St
- 51 Progress St