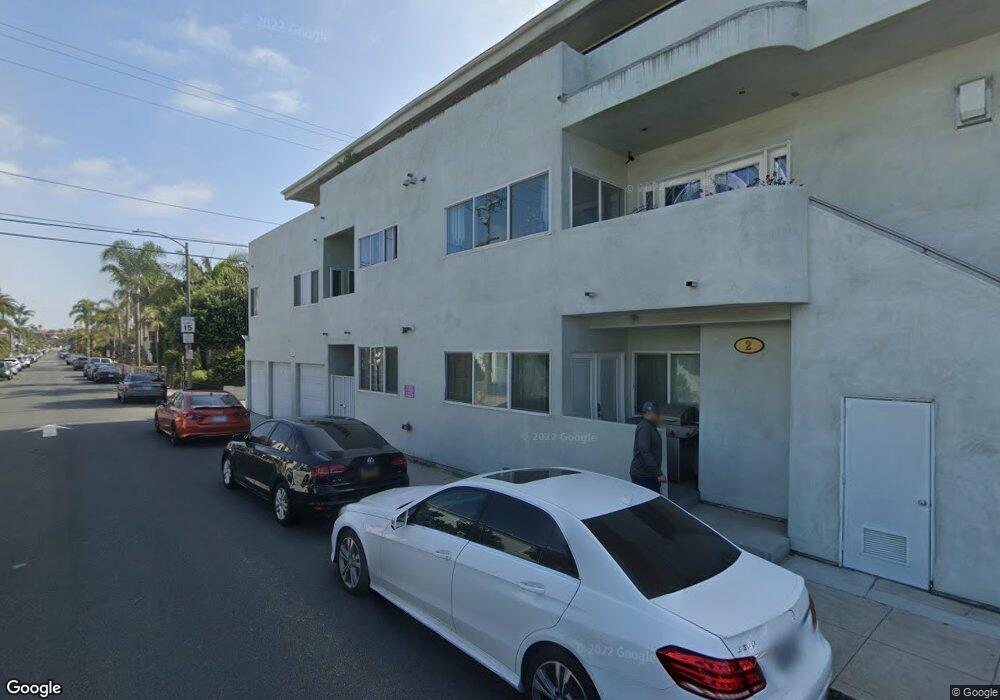
2 Prospect Ave Long Beach, CA 90803
Belmont Shore NeighborhoodEstimated Value: $1,992,000 - $2,650,851
6
Beds
5
Baths
4,164
Sq Ft
$587/Sq Ft
Est. Value
About This Home
This home is located at 2 Prospect Ave, Long Beach, CA 90803 and is currently estimated at $2,446,213, approximately $587 per square foot. 2 Prospect Ave is a home located in Los Angeles County with nearby schools including Lowell Elementary School, Rogers Middle School, and Woodrow Wilson High School.
Ownership History
Date
Name
Owned For
Owner Type
Purchase Details
Closed on
Sep 20, 2016
Sold by
Lloyd Margaret
Bought by
Lloyd Margaret Ann and The Margaret Ann Lloyd Family
Current Estimated Value
Purchase Details
Closed on
Apr 23, 2009
Sold by
Lloyd Margaret
Bought by
Lloyd Margaret
Home Financials for this Owner
Home Financials are based on the most recent Mortgage that was taken out on this home.
Original Mortgage
$300,000
Outstanding Balance
$188,218
Interest Rate
4.8%
Mortgage Type
Credit Line Revolving
Estimated Equity
$2,257,995
Purchase Details
Closed on
May 7, 2004
Sold by
Trailor Larry Allen and Trailor Linda Beth
Bought by
Lloyd Margaret
Home Financials for this Owner
Home Financials are based on the most recent Mortgage that was taken out on this home.
Original Mortgage
$835,000
Outstanding Balance
$544,513
Interest Rate
3.88%
Mortgage Type
Purchase Money Mortgage
Estimated Equity
$1,901,700
Create a Home Valuation Report for This Property
The Home Valuation Report is an in-depth analysis detailing your home's value as well as a comparison with similar homes in the area
Home Values in the Area
Average Home Value in this Area
Purchase History
| Date | Buyer | Sale Price | Title Company |
|---|---|---|---|
| Lloyd Margaret Ann | -- | None Available | |
| Lloyd Margaret | -- | Lawyers Title Co | |
| Lloyd Margaret | $1,235,000 | Ticor Title |
Source: Public Records
Mortgage History
| Date | Status | Borrower | Loan Amount |
|---|---|---|---|
| Open | Lloyd Margaret | $300,000 | |
| Open | Lloyd Margaret | $835,000 |
Source: Public Records
Tax History
| Year | Tax Paid | Tax Assessment Tax Assessment Total Assessment is a certain percentage of the fair market value that is determined by local assessors to be the total taxable value of land and additions on the property. | Land | Improvement |
|---|---|---|---|---|
| 2025 | $24,077 | $1,904,318 | $1,494,726 | $409,592 |
| 2024 | $24,077 | $1,866,979 | $1,465,418 | $401,561 |
| 2023 | $23,091 | $1,830,373 | $1,436,685 | $393,688 |
| 2022 | $22,095 | $1,794,484 | $1,408,515 | $385,969 |
| 2021 | $21,658 | $1,759,299 | $1,380,898 | $378,401 |
| 2019 | $21,346 | $1,707,329 | $1,339,941 | $367,388 |
| 2018 | $20,822 | $1,673,857 | $1,313,668 | $360,189 |
| 2016 | $19,144 | $1,608,658 | $1,262,657 | $346,001 |
| 2015 | $14,039 | $1,200,000 | $941,900 | $258,100 |
| 2014 | $14,206 | $1,200,000 | $941,900 | $258,100 |
Source: Public Records
Map
Nearby Homes
- 34 Ximeno Ave
- 24 Roswell Ave
- 111 Ximeno Ave
- 4401 E Division St
- 70 Saint Joseph Ave
- 143 Roycroft Ave
- 150 Ximeno Ave
- 28 Argonne Ave
- 75 Granada Ave
- 3939 E Allin St Unit 109
- 116 Termino Ave
- 132 Belmont Ave
- 16 38th Place
- 202 Mira Mar Ave
- 223 Bennett Ave
- 4527 E Shaw St
- 207 Mira Mar Ave
- 3704 E 2nd St
- 3665 E 1st St Unit 408
- 210 Grand Ave Unit 201
- 4507 E Ocean Blvd
- 4509 E Ocean Blvd
- 22 Prospect Ave
- 4515 E Ocean Blvd
- 4435 E Ocean Blvd
- 28 Prospect Ave
- 4521 E Ocean Blvd
- 21 Prospect Ave
- 19 Quincy Ave
- 27 Prospect Ave
- 5 Quincy Ave
- 25 Quincy Ave
- 35 Prospect Ave
- 4401 E Ocean Blvd Unit 5
- 4401 E Ocean Blvd Unit 2
- 4401 E Ocean Blvd
- 40 Prospect Ave
- 33 Quincy Ave
- 39 Prospect Ave
- 20 Ximeno Ave
Your Personal Tour Guide
Ask me questions while you tour the home.