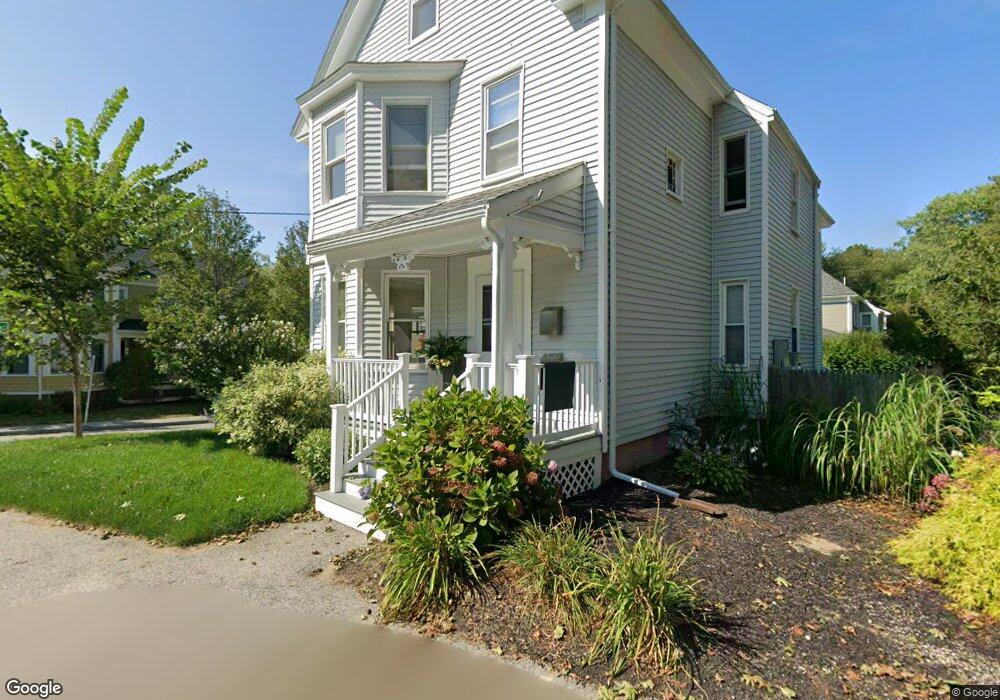
2 Putnam Ct Manchester, MA 01944
Estimated Value: $954,417 - $1,035,000
3
Beds
2
Baths
1,487
Sq Ft
$672/Sq Ft
Est. Value
About This Home
This home is located at 2 Putnam Ct, Manchester, MA 01944 and is currently estimated at $999,854, approximately $672 per square foot. 2 Putnam Ct is a home located in Essex County with nearby schools including Manchester Essex Regional High School, Tara Montessori School, and Glen Urquhart School.
Ownership History
Date
Name
Owned For
Owner Type
Purchase Details
Closed on
Oct 5, 2022
Sold by
Lee Rt and Lee
Bought by
Aam Danvers Residences
Current Estimated Value
Purchase Details
Closed on
Sep 25, 2008
Sold by
Watt Hope M
Bought by
Watt-Bucci Hope M
Purchase Details
Closed on
Oct 25, 2000
Sold by
Silva Faith A
Bought by
Watt Hope M
Create a Home Valuation Report for This Property
The Home Valuation Report is an in-depth analysis detailing your home's value as well as a comparison with similar homes in the area
Home Values in the Area
Average Home Value in this Area
Purchase History
| Date | Buyer | Sale Price | Title Company |
|---|---|---|---|
| Aam Danvers Residences | $2,590,800 | None Available | |
| Watt-Bucci Hope M | -- | -- | |
| Watt Hope M | $80,000 | -- |
Source: Public Records
Mortgage History
| Date | Status | Borrower | Loan Amount |
|---|---|---|---|
| Previous Owner | Watt Hope M | $179,000 | |
| Previous Owner | Watt Hope M | $50,000 | |
| Previous Owner | Watt Hope M | $155,000 |
Source: Public Records
Tax History
| Year | Tax Paid | Tax Assessment Tax Assessment Total Assessment is a certain percentage of the fair market value that is determined by local assessors to be the total taxable value of land and additions on the property. | Land | Improvement |
|---|---|---|---|---|
| 2025 | $7,658 | $836,900 | $414,100 | $422,800 |
| 2024 | $7,316 | $782,500 | $394,300 | $388,200 |
| 2023 | $7,210 | $691,300 | $353,300 | $338,000 |
| 2022 | $6,813 | $642,700 | $320,400 | $322,300 |
| 2021 | $6,978 | $634,900 | $320,400 | $314,500 |
| 2020 | $7,081 | $605,200 | $304,000 | $301,200 |
| 2019 | $6,576 | $585,600 | $289,200 | $296,400 |
| 2018 | $6,459 | $585,600 | $289,200 | $296,400 |
| 2017 | $6,152 | $559,300 | $262,900 | $296,400 |
| 2016 | $5,940 | $536,600 | $262,900 | $273,700 |
| 2015 | $5,642 | $520,500 | $246,500 | $274,000 |
Source: Public Records
Map
Nearby Homes
Your Personal Tour Guide
Ask me questions while you tour the home.