Estimated Value: $668,000 - $725,000
3
Beds
3
Baths
1,928
Sq Ft
$364/Sq Ft
Est. Value
About This Home
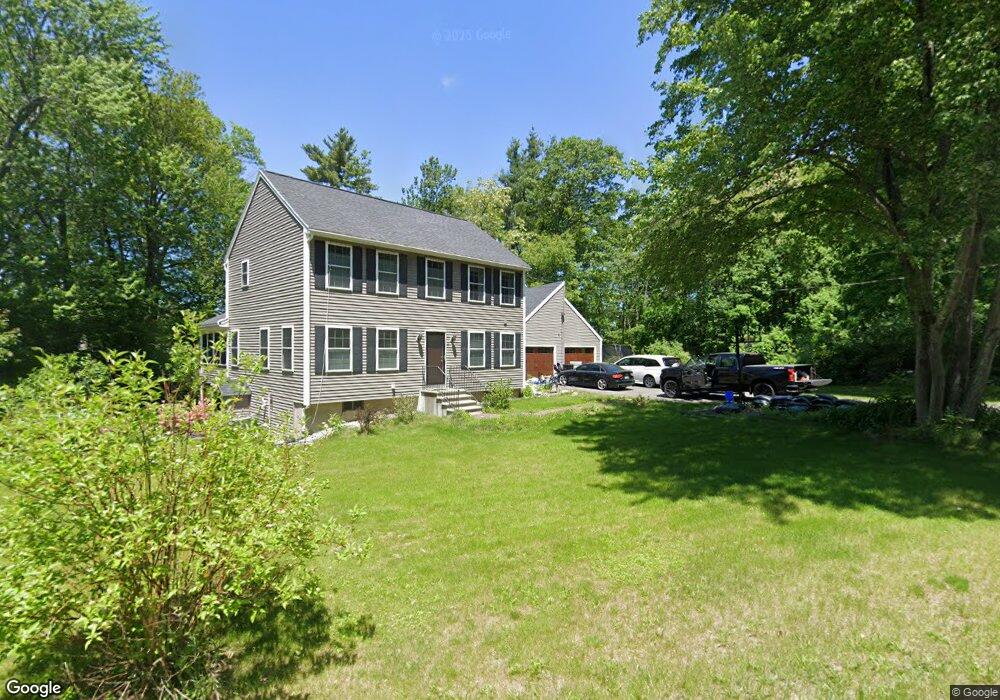
This home is located at 2 Redfield Cir, Derry, NH 03038 and is currently estimated at $701,334, approximately $363 per square foot. 2 Redfield Cir is a home located in Rockingham County with nearby schools including Derry Village School, West Running Brook Middle School, and Pinkerton Academy.
Ownership History
Date
Name
Owned For
Owner Type
Purchase Details
Closed on
May 16, 2023
Sold by
Ghanem John and All Cheryl A
Bought by
All Cheryl A
Current Estimated Value
Purchase Details
Closed on
Nov 20, 2014
Sold by
Ghanem John P
Bought by
Ghanem John P and Ghanem Cheryln
Purchase Details
Closed on
Jun 19, 2000
Sold by
Scarfo Gregory H and Scarfo Maureen M
Bought by
Ghanem John P and Ghanem Dina J
Home Financials for this Owner
Home Financials are based on the most recent Mortgage that was taken out on this home.
Original Mortgage
$167,200
Interest Rate
8.24%
Mortgage Type
Purchase Money Mortgage
Purchase Details
Closed on
Aug 25, 1997
Sold by
Fisher Carolyn P
Bought by
Department Of Housing & Urban Dev
Create a Home Valuation Report for This Property
The Home Valuation Report is an in-depth analysis detailing your home's value as well as a comparison with similar homes in the area
Home Values in the Area
Average Home Value in this Area
Purchase History
| Date | Buyer | Sale Price | Title Company |
|---|---|---|---|
| All Cheryl A | -- | None Available | |
| Ghanem John P | -- | -- | |
| Ghanem John P | $176,000 | -- | |
| Department Of Housing & Urban Dev | $123,100 | -- |
Source: Public Records
Mortgage History
| Date | Status | Borrower | Loan Amount |
|---|---|---|---|
| Previous Owner | Department Of Housing & Urban Dev | $200,100 | |
| Previous Owner | Department Of Housing & Urban Dev | $167,200 | |
| Previous Owner | Department Of Housing & Urban Dev | $111,963 |
Source: Public Records
Tax History
| Year | Tax Paid | Tax Assessment Tax Assessment Total Assessment is a certain percentage of the fair market value that is determined by local assessors to be the total taxable value of land and additions on the property. | Land | Improvement |
|---|---|---|---|---|
| 2025 | $12,438 | $655,000 | $198,500 | $456,500 |
| 2024 | $12,242 | $655,000 | $198,500 | $456,500 |
| 2023 | $12,251 | $592,400 | $168,800 | $423,600 |
| 2022 | $11,279 | $592,400 | $168,800 | $423,600 |
| 2021 | $10,434 | $421,400 | $128,800 | $292,600 |
| 2020 | $10,254 | $421,300 | $128,800 | $292,500 |
| 2019 | $10,278 | $393,500 | $98,500 | $295,000 |
| 2018 | $6,984 | $393,500 | $98,500 | $295,000 |
| 2017 | $8,003 | $277,300 | $91,600 | $185,700 |
| 2016 | $6,807 | $231,200 | $91,600 | $139,600 |
| 2015 | $6,454 | $220,800 | $91,600 | $129,200 |
| 2014 | $6,496 | $220,800 | $91,600 | $129,200 |
| 2013 | $6,418 | $203,800 | $81,800 | $122,000 |
Source: Public Records
Map
Nearby Homes
- 15 Bonnie Ln Unit R
- 47 Drew Woods Dr
- 89 Lane Rd
- 3 Pine Bluff
- 12 Halls Village Rd
- 211 Hampstead Rd
- 5 Stone Fence Dr
- 4C Pine Isle Dr Unit B
- 18 N Shore Rd
- 32 Chester Rd
- 1 Grandview Ave
- 144 Rockingham Rd
- 7 Chester Rd Unit 212
- 139 Rockingham Rd Unit 21
- 4 Pembroke Dr Unit 22
- 76 Tsienneto Rd
- 5 Nesmith St
- 7 Birchwood Dr
- 9 Barkland Dr
- 21 Berry Rd
Your Personal Tour Guide
Ask me questions while you tour the home.