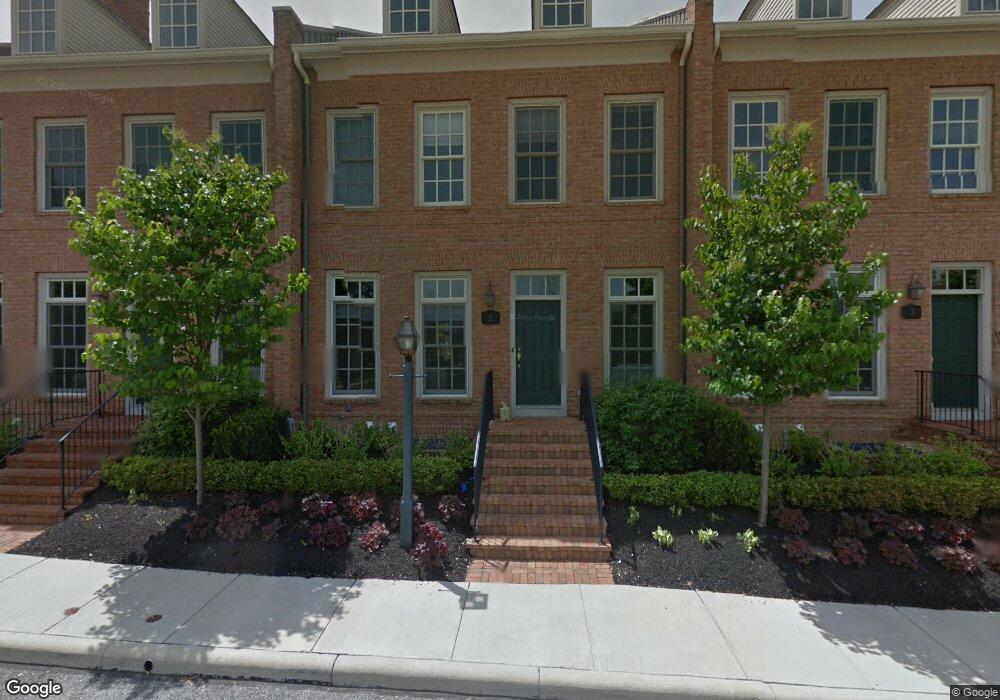
2 Richmond Square Unit Richmond Square New Albany, OH 43054
Estimated Value: $779,000 - $968,000
2
Beds
2
Baths
2,363
Sq Ft
$359/Sq Ft
Est. Value
About This Home
This home is located at 2 Richmond Square Unit Richmond Square, New Albany, OH 43054 and is currently estimated at $847,846, approximately $358 per square foot. 2 Richmond Square Unit Richmond Square is a home located in Franklin County with nearby schools including New Albany Primary School, New Albany Intermediate School, and New Albany Middle School.
Ownership History
Date
Name
Owned For
Owner Type
Purchase Details
Closed on
Aug 2, 2024
Sold by
Ingram Edgar W
Bought by
Robert Christopher Ingram Irrevocable Trust and Ingram
Current Estimated Value
Purchase Details
Closed on
Sep 19, 2023
Sold by
Desai Eric S and Desai Tejal
Bought by
Ingram Edgar
Home Financials for this Owner
Home Financials are based on the most recent Mortgage that was taken out on this home.
Original Mortgage
$496,524
Interest Rate
6.96%
Mortgage Type
New Conventional
Purchase Details
Closed on
Apr 14, 2011
Sold by
Richmond Square Llc
Bought by
Desai Eric S and Patel Tejal
Home Financials for this Owner
Home Financials are based on the most recent Mortgage that was taken out on this home.
Original Mortgage
$259,000
Interest Rate
4.93%
Mortgage Type
Purchase Money Mortgage
Create a Home Valuation Report for This Property
The Home Valuation Report is an in-depth analysis detailing your home's value as well as a comparison with similar homes in the area
Home Values in the Area
Average Home Value in this Area
Purchase History
| Date | Buyer | Sale Price | Title Company |
|---|---|---|---|
| Robert Christopher Ingram Irrevocable Trust | -- | None Listed On Document | |
| Ingram Edgar | $715,000 | Stewart Title | |
| Desai Eric S | $370,000 | Ohio Title |
Source: Public Records
Mortgage History
| Date | Status | Borrower | Loan Amount |
|---|---|---|---|
| Previous Owner | Ingram Edgar | $496,524 | |
| Previous Owner | Desai Eric S | $259,000 |
Source: Public Records
Tax History Compared to Growth
Tax History
| Year | Tax Paid | Tax Assessment Tax Assessment Total Assessment is a certain percentage of the fair market value that is determined by local assessors to be the total taxable value of land and additions on the property. | Land | Improvement |
|---|---|---|---|---|
| 2024 | $12,871 | $202,340 | $39,380 | $162,960 |
| 2023 | $11,056 | $187,220 | $39,380 | $147,840 |
| 2022 | $12,281 | $158,700 | $23,490 | $135,210 |
| 2021 | $11,820 | $158,700 | $23,490 | $135,210 |
| 2020 | $11,784 | $158,700 | $23,490 | $135,210 |
| 2019 | $11,800 | $144,270 | $21,350 | $122,920 |
| 2018 | $11,311 | $144,270 | $21,350 | $122,920 |
| 2017 | $11,719 | $144,270 | $21,350 | $122,920 |
| 2016 | $11,004 | $124,670 | $21,210 | $103,460 |
| 2015 | $10,526 | $124,670 | $21,210 | $103,460 |
| 2014 | $10,336 | $124,670 | $21,210 | $103,460 |
| 2013 | $626 | $8,120 | $8,120 | $0 |
Source: Public Records
Map
Nearby Homes
- 7 Richmond Square
- 14 Richmond Square
- 5950 Johnstown Rd
- 5945 Johnstown Rd
- 115 Keswick Dr
- 105 Keswick Dr
- 109 Keswick Dr
- 7362 Tottenham Place
- 6929 Clivdon Mews
- 4135 High Grove Crest
- 6834 Cedar Brook Glen
- 7030 Hanby's Loop
- 6813 Ridge Rock Dr Unit 14
- 6923 Rothwell St Unit 46923
- 6931 Rothwell St Unit 36931
- 7444 Farmington Close
- 4774 Bosk Dr
- 3637 Head of Pond Rd
- 7747 Sutton Place
- 5556 Falco Dr
- 2 Richmond Square
- 1 Richmond Square
- 3 Richmond Square
- 4 Richmond Square
- 5 Richmond Square
- 6 Richmond Square
- 7706 Alpath Rd
- 8 Richmond Square
- 9 Richmond Square
- 10 Richmond Square
- 13 Richmond Square
- 11 Richmond Square
- 7651 Ogden Woods Blvd
- 7665 Ogden Woods Blvd Unit 13
- 12 Richmond Square
- 6066 Johnstown Rd
- 62 Main St
- 15 Richmond Square
- 7703 Alpath Rd
- 282 Main St Unit 38529827