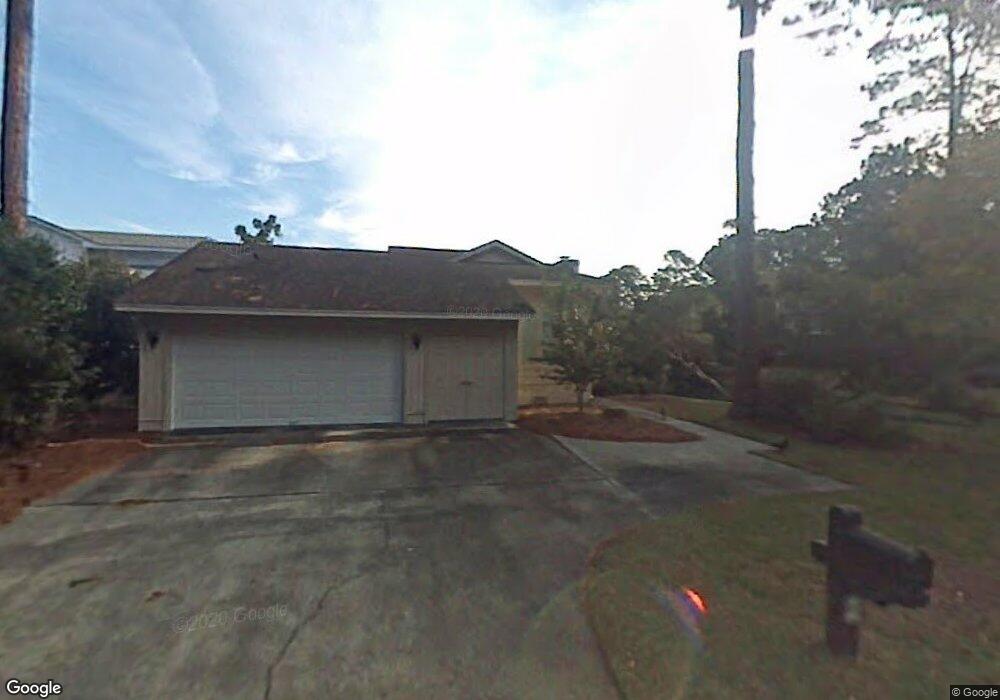
2 Riding Ln Savannah, GA 31411
Estimated Value: $722,000 - $746,000
3
Beds
3
Baths
1,922
Sq Ft
$382/Sq Ft
Est. Value
About This Home
This home is located at 2 Riding Ln, Savannah, GA 31411 and is currently estimated at $734,428, approximately $382 per square foot. 2 Riding Ln is a home located in Chatham County with nearby schools including Hesse School and Jenkins High School.
Ownership History
Date
Name
Owned For
Owner Type
Purchase Details
Closed on
Aug 5, 2025
Sold by
Cardenas Ronnie Carl
Bought by
Redding Lorraine S and Mcgirr Mary E
Current Estimated Value
Purchase Details
Closed on
Apr 8, 2022
Sold by
Ost Judith A
Bought by
Cardenas Ronnie Carl
Purchase Details
Closed on
Apr 22, 2020
Sold by
Ost Michael Stuart
Bought by
Ost Judith A
Purchase Details
Closed on
Nov 5, 2019
Sold by
Ost Judith A
Bought by
Ost Judith A and Ost Philip Stuart
Purchase Details
Closed on
Jun 27, 2018
Sold by
Sass Ryan B
Bought by
Ost Michael S and Ost Judith A
Purchase Details
Closed on
Oct 23, 2014
Sold by
Saunders Arthur L
Bought by
Sass Ryan B and Wilson Cathlin A
Home Financials for this Owner
Home Financials are based on the most recent Mortgage that was taken out on this home.
Original Mortgage
$275,283
Interest Rate
3.75%
Mortgage Type
New Conventional
Create a Home Valuation Report for This Property
The Home Valuation Report is an in-depth analysis detailing your home's value as well as a comparison with similar homes in the area
Home Values in the Area
Average Home Value in this Area
Purchase History
| Date | Buyer | Sale Price | Title Company |
|---|---|---|---|
| Redding Lorraine S | $730,000 | -- | |
| Cardenas Ronnie Carl | $689,000 | -- | |
| Ost Judith A | -- | -- | |
| Ost Judith A | -- | -- | |
| Ost Judith A | -- | -- | |
| Ost Michael S | $400,000 | -- | |
| Sass Ryan B | $267,000 | -- |
Source: Public Records
Mortgage History
| Date | Status | Borrower | Loan Amount |
|---|---|---|---|
| Previous Owner | Sass Ryan B | $275,283 |
Source: Public Records
Tax History Compared to Growth
Tax History
| Year | Tax Paid | Tax Assessment Tax Assessment Total Assessment is a certain percentage of the fair market value that is determined by local assessors to be the total taxable value of land and additions on the property. | Land | Improvement |
|---|---|---|---|---|
| 2025 | $696 | $306,200 | $90,000 | $216,200 |
| 2024 | $696 | $283,520 | $90,000 | $193,520 |
| 2023 | $1,392 | $249,240 | $58,000 | $191,240 |
| 2022 | $3,366 | $170,080 | $33,080 | $137,000 |
| 2021 | $5,134 | $131,880 | $33,080 | $98,800 |
| 2020 | $3,383 | $125,320 | $33,080 | $92,240 |
| 2019 | $3,468 | $131,560 | $33,080 | $98,480 |
| 2018 | $2,970 | $96,840 | $33,080 | $63,760 |
| 2017 | $2,800 | $98,640 | $33,080 | $65,560 |
| 2016 | $2,843 | $91,080 | $33,080 | $58,000 |
| 2015 | $4,729 | $102,520 | $33,080 | $69,440 |
| 2014 | $4,525 | $109,400 | $0 | $0 |
Source: Public Records
Map
Nearby Homes
- 2 Franklin Creek Rd S
- 7 Springpine Ln
- 5 Franklin Ct
- 15 Franklin Creek Rd N
- 2 Breakfast Ct
- 5 Clairborn Retreat
- 3 Waterford Ln
- 2 Low Country Ln
- 22 Deer Run
- 1 Carlow Ln
- 11 Calico Crab Retreat
- 5 Leatherwood Ln
- 1 Gumtree Ln
- 29 Black Hawk Trail
- 6 River Otter Ln
- 5 Skipjack Ln
- 5 Sparkleberry Ln
- 2 Broomsedge Ln
- 43 Cabbage Crossing
- 136 Saltwater Way