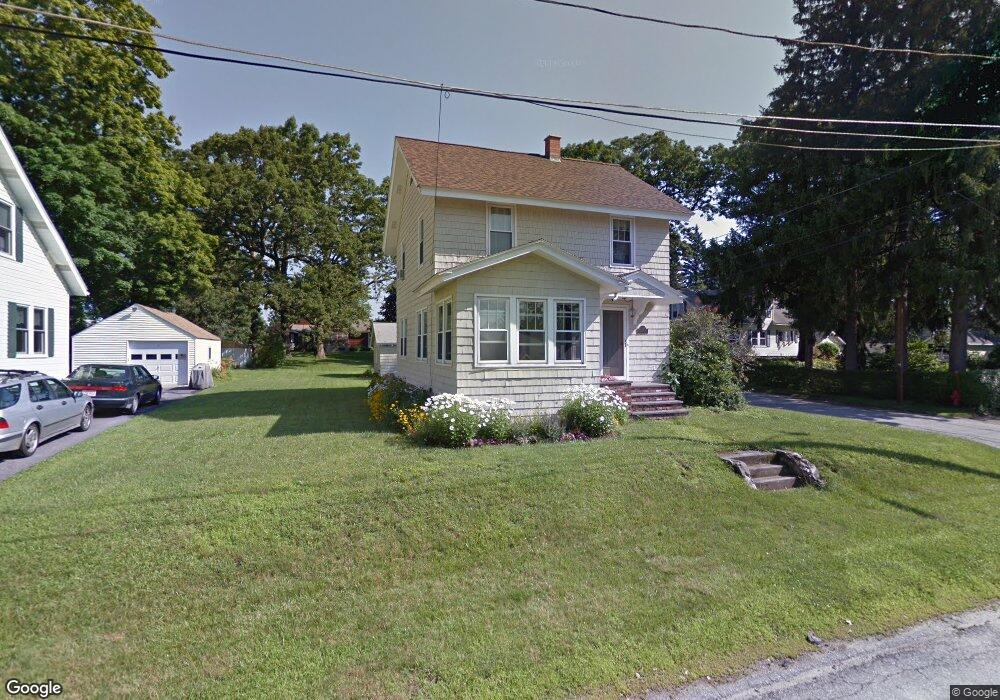
2 Robert Ave Auburn, MA 01501
Stoneville NeighborhoodEstimated Value: $424,281 - $466,000
3
Beds
2
Baths
1,306
Sq Ft
$346/Sq Ft
Est. Value
About This Home
This home is located at 2 Robert Ave, Auburn, MA 01501 and is currently estimated at $451,820, approximately $345 per square foot. 2 Robert Ave is a home located in Worcester County with nearby schools including Auburn Senior High School and Shrewsbury Montessori School - Auburn Campus.
Ownership History
Date
Name
Owned For
Owner Type
Purchase Details
Closed on
Jan 27, 2000
Sold by
Nims-Gentry Nancy N
Bought by
Curnen Mary Elizabeth and Curnen Michael D
Current Estimated Value
Create a Home Valuation Report for This Property
The Home Valuation Report is an in-depth analysis detailing your home's value as well as a comparison with similar homes in the area
Home Values in the Area
Average Home Value in this Area
Purchase History
| Date | Buyer | Sale Price | Title Company |
|---|---|---|---|
| Curnen Mary Elizabeth | $137,350 | -- |
Source: Public Records
Mortgage History
| Date | Status | Borrower | Loan Amount |
|---|---|---|---|
| Open | Curnen Mary Elizabeth | $163,600 | |
| Closed | Curnen Mary Elizabeth | $142,500 | |
| Closed | Curnen Mary Elizabeth | $140,000 |
Source: Public Records
Tax History
| Year | Tax Paid | Tax Assessment Tax Assessment Total Assessment is a certain percentage of the fair market value that is determined by local assessors to be the total taxable value of land and additions on the property. | Land | Improvement |
|---|---|---|---|---|
| 2025 | $51 | $359,800 | $113,700 | $246,100 |
| 2024 | $4,937 | $330,700 | $108,000 | $222,700 |
| 2023 | $4,901 | $308,600 | $98,100 | $210,500 |
| 2022 | $4,631 | $275,300 | $98,100 | $177,200 |
| 2021 | $4,306 | $237,400 | $86,600 | $150,800 |
| 2020 | $4,114 | $228,800 | $86,600 | $142,200 |
| 2019 | $5,357 | $210,000 | $85,700 | $124,300 |
| 2018 | $5,423 | $197,400 | $80,100 | $117,300 |
| 2017 | $4,796 | $189,900 | $72,600 | $117,300 |
| 2016 | $3,122 | $172,600 | $76,200 | $96,400 |
| 2015 | $2,900 | $168,000 | $76,200 | $91,800 |
| 2014 | $2,837 | $164,100 | $72,500 | $91,600 |
Source: Public Records
Map
Nearby Homes
- 5 Commonwealth Ave
- 177 Boyce St
- 25 Vinal St Unit 28
- 25 Vinal St Unit 26
- 25 Vinal St Unit 29
- 25 Vinal St Unit 30
- 1 Rockland Road Ct
- 99 Clover St
- 177 Oxford St N
- 204-212 Hampton St
- 31-33 Walsh Ave
- 33 Walsh Ave
- 31 Walsh Ave
- 19-20 Williams St
- 40 Bryn Mawr Ave
- 11 Hulbert Rd Unit 13
- 6 Buron Terrace
- 27 Havana Rd
- 33 Eastford Rd
- 154 Pakachoag St
Your Personal Tour Guide
Ask me questions while you tour the home.