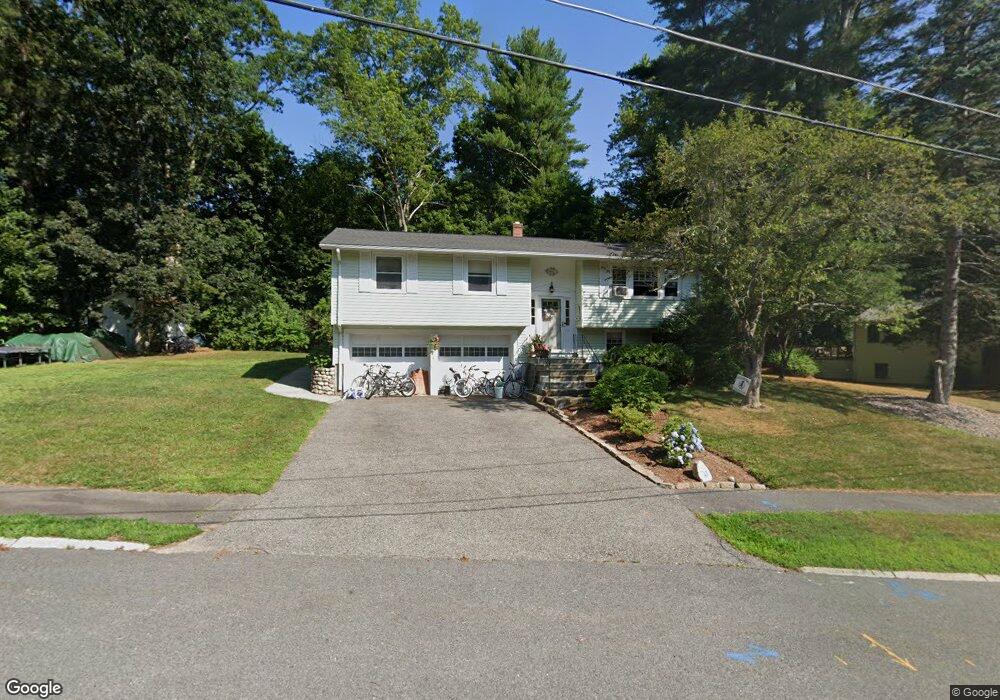
2 Robert St Foxboro, MA 02035
Estimated Value: $495,000 - $637,000
3
Beds
2
Baths
1,074
Sq Ft
$533/Sq Ft
Est. Value
About This Home
This home is located at 2 Robert St, Foxboro, MA 02035 and is currently estimated at $572,144, approximately $532 per square foot. 2 Robert St is a home located in Norfolk County with nearby schools including Foxborough High School, Foxborough Regional Charter School, and Hands-On-Montessori School.
Ownership History
Date
Name
Owned For
Owner Type
Purchase Details
Closed on
May 8, 1998
Sold by
Metrano Frank V
Bought by
Galanti Eric A and Galanti Diane E
Current Estimated Value
Home Financials for this Owner
Home Financials are based on the most recent Mortgage that was taken out on this home.
Original Mortgage
$116,900
Interest Rate
7.05%
Mortgage Type
Purchase Money Mortgage
Create a Home Valuation Report for This Property
The Home Valuation Report is an in-depth analysis detailing your home's value as well as a comparison with similar homes in the area
Home Values in the Area
Average Home Value in this Area
Purchase History
| Date | Buyer | Sale Price | Title Company |
|---|---|---|---|
| Galanti Eric A | $135,100 | -- |
Source: Public Records
Mortgage History
| Date | Status | Borrower | Loan Amount |
|---|---|---|---|
| Open | Galanti Eric A | $255,000 | |
| Closed | Galanti Eric A | $121,200 | |
| Closed | Galanti Eric A | $116,900 |
Source: Public Records
Tax History
| Year | Tax Paid | Tax Assessment Tax Assessment Total Assessment is a certain percentage of the fair market value that is determined by local assessors to be the total taxable value of land and additions on the property. | Land | Improvement |
|---|---|---|---|---|
| 2025 | $6,548 | $495,300 | $251,900 | $243,400 |
| 2024 | $6,374 | $471,800 | $251,900 | $219,900 |
| 2023 | $6,201 | $436,400 | $239,900 | $196,500 |
| 2022 | $6,059 | $417,300 | $229,600 | $187,700 |
| 2021 | $5,604 | $380,200 | $208,700 | $171,500 |
| 2020 | $5,267 | $361,500 | $208,700 | $152,800 |
| 2019 | $5,127 | $348,800 | $198,700 | $150,100 |
| 2018 | $4,967 | $340,900 | $198,700 | $142,200 |
| 2017 | $4,832 | $321,300 | $185,700 | $135,600 |
| 2016 | $4,781 | $322,600 | $178,800 | $143,800 |
| 2015 | $4,519 | $297,500 | $151,000 | $146,500 |
| 2014 | $4,415 | $294,500 | $148,000 | $146,500 |
Source: Public Records
Map
Nearby Homes
- 356 Central St
- 166 Chauncy St
- 152 Central St
- 73-75 Draper Ave
- 233 Central St
- 150 Rumford Ave Unit 110
- 4 Concetta Cir
- 266 N Main St Unit 3
- 619 N Main St
- 22 Pleasant St Unit C
- 346 South St
- 155 South St
- 157 Central St
- 81 Chilson Ave
- 28 Court St
- 44 Fairfield Park Unit 44
- 67 Carpenter St
- 46 Hope St
- 13 Summerville Rd Unit 13
- 26 Fuller Rd Unit 6
Your Personal Tour Guide
Ask me questions while you tour the home.