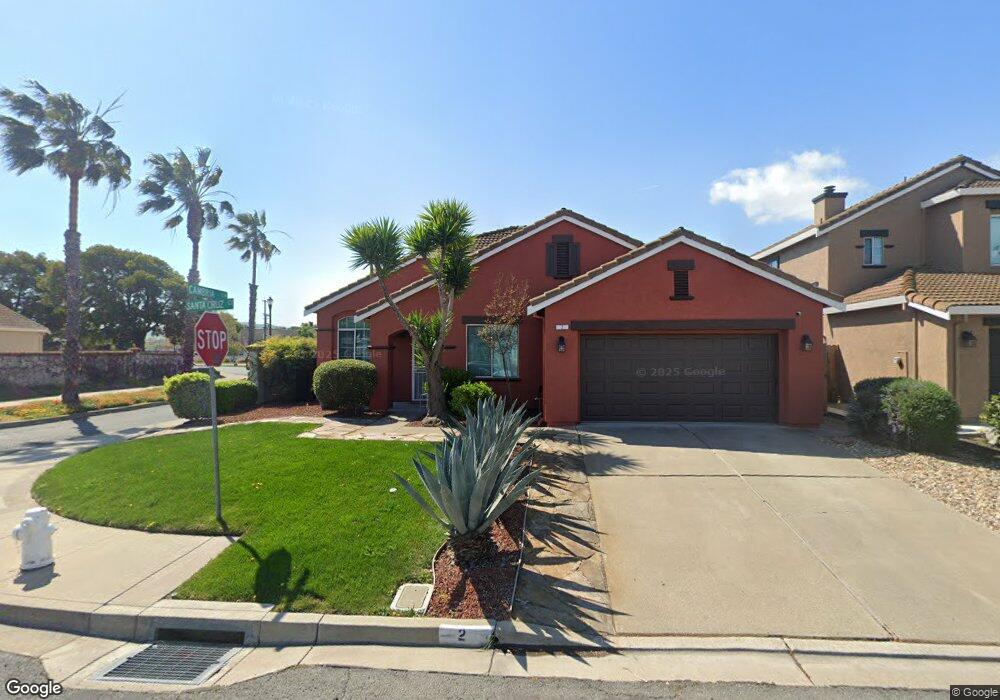
2 Santa Cruz Ct Pittsburg, CA 94565
Downtown Pittsburg NeighborhoodEstimated Value: $585,141 - $682,000
3
Beds
2
Baths
1,793
Sq Ft
$358/Sq Ft
Est. Value
About This Home
This home is located at 2 Santa Cruz Ct, Pittsburg, CA 94565 and is currently estimated at $641,535, approximately $357 per square foot. 2 Santa Cruz Ct is a home located in Contra Costa County with nearby schools including Marina Vista Elementary School, Martin Luther King Jr. Junior High School, and Pittsburg Senior High School.
Ownership History
Date
Name
Owned For
Owner Type
Purchase Details
Closed on
Nov 15, 2019
Sold by
Willams Deneshia
Bought by
Willams Deneshia
Current Estimated Value
Purchase Details
Closed on
Jun 27, 2013
Sold by
Chaimungkla Surat and Chaimungkla Phnawan
Bought by
Williams Deneshia
Home Financials for this Owner
Home Financials are based on the most recent Mortgage that was taken out on this home.
Original Mortgage
$315,250
Outstanding Balance
$225,804
Interest Rate
3.57%
Mortgage Type
New Conventional
Estimated Equity
$415,731
Purchase Details
Closed on
Nov 15, 1994
Sold by
Eastside Associates
Bought by
Chaimungkla Surat and Chaimungkla Phnawan
Home Financials for this Owner
Home Financials are based on the most recent Mortgage that was taken out on this home.
Original Mortgage
$122,450
Interest Rate
8.91%
Mortgage Type
Purchase Money Mortgage
Create a Home Valuation Report for This Property
The Home Valuation Report is an in-depth analysis detailing your home's value as well as a comparison with similar homes in the area
Home Values in the Area
Average Home Value in this Area
Purchase History
| Date | Buyer | Sale Price | Title Company |
|---|---|---|---|
| Willams Deneshia | -- | None Available | |
| Williams Deneshia | $325,000 | Chicago Title Company | |
| Chaimungkla Surat | $153,500 | Financial Title Company |
Source: Public Records
Mortgage History
| Date | Status | Borrower | Loan Amount |
|---|---|---|---|
| Open | Williams Deneshia | $315,250 | |
| Previous Owner | Chaimungkla Surat | $122,450 |
Source: Public Records
Tax History Compared to Growth
Tax History
| Year | Tax Paid | Tax Assessment Tax Assessment Total Assessment is a certain percentage of the fair market value that is determined by local assessors to be the total taxable value of land and additions on the property. | Land | Improvement |
|---|---|---|---|---|
| 2025 | $4,913 | $398,394 | $85,804 | $312,590 |
| 2024 | $4,943 | $390,583 | $84,122 | $306,461 |
| 2023 | $4,943 | $382,925 | $82,473 | $300,452 |
| 2022 | $5,014 | $375,417 | $80,856 | $294,561 |
| 2021 | $5,561 | $368,057 | $79,271 | $288,786 |
| 2019 | $5,802 | $357,142 | $76,921 | $280,221 |
| 2018 | $5,636 | $350,140 | $75,413 | $274,727 |
| 2017 | $5,711 | $343,276 | $73,935 | $269,341 |
| 2016 | $5,312 | $336,546 | $72,486 | $264,060 |
| 2015 | $5,600 | $331,492 | $71,398 | $260,094 |
| 2014 | $5,495 | $325,000 | $70,000 | $255,000 |
Source: Public Records
Map
Nearby Homes
- 449-451 E 9th St
- 340 Cumberland St
- 1100 Harbor St
- 301 Central Ave
- 161 Edgewater Place
- 310 Central Ave
- 65 Edgewater Place
- 65 Locust Dr
- Daphne Plan at Liberty II
- Charlotte Plan at Liberty II
- Aubrey Plan at Liberty II
- Baxter Plan at Liberty II
- 286 Mindy Way
- 278 Mindy Way
- 270 Mindy Way
- 76 Cornwall St
- 262 Mindy Way
- 118 Pelican Loop
- 532 Central Ave
- 115 Pelican Loop