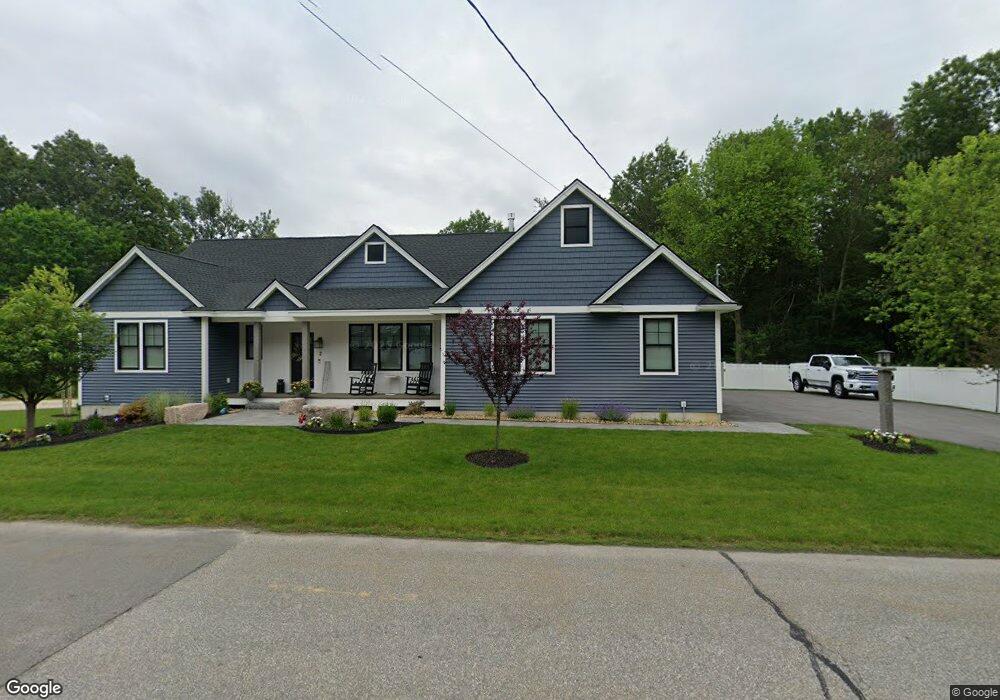
2 Shady Ln Nashua, NH 03062
Southwest Nashua NeighborhoodEstimated Value: $551,000 - $770,000
3
Beds
3
Baths
2,625
Sq Ft
$264/Sq Ft
Est. Value
About This Home
This home is located at 2 Shady Ln, Nashua, NH 03062 and is currently estimated at $692,633, approximately $263 per square foot. 2 Shady Ln is a home with nearby schools including New Searles School, Fairgrounds Middle School, and Nashua High School South.
Ownership History
Date
Name
Owned For
Owner Type
Purchase Details
Closed on
Oct 8, 2020
Sold by
Colby Thomas J
Bought by
Cote David J and Cote Sharon
Current Estimated Value
Purchase Details
Closed on
Jun 30, 2014
Sold by
Seroll Scott and Seroll Vanessa
Bought by
Colby Thomas J
Purchase Details
Closed on
Aug 28, 2009
Sold by
Lefebvre Cecile P
Bought by
Seroll Scott and Seroll Vanessa
Home Financials for this Owner
Home Financials are based on the most recent Mortgage that was taken out on this home.
Original Mortgage
$201,286
Interest Rate
5.17%
Mortgage Type
Purchase Money Mortgage
Create a Home Valuation Report for This Property
The Home Valuation Report is an in-depth analysis detailing your home's value as well as a comparison with similar homes in the area
Home Values in the Area
Average Home Value in this Area
Purchase History
| Date | Buyer | Sale Price | Title Company |
|---|---|---|---|
| Cote David J | $299,933 | None Available | |
| Cote David J | $299,933 | None Available | |
| Colby Thomas J | $222,500 | -- | |
| Colby Thomas J | $222,500 | -- | |
| Seroll Scott | $205,000 | -- | |
| Seroll Scott | $205,000 | -- |
Source: Public Records
Mortgage History
| Date | Status | Borrower | Loan Amount |
|---|---|---|---|
| Previous Owner | Seroll Scott | $201,225 | |
| Previous Owner | Seroll Scott | $201,286 | |
| Closed | Seroll Scott | $0 |
Source: Public Records
Tax History Compared to Growth
Tax History
| Year | Tax Paid | Tax Assessment Tax Assessment Total Assessment is a certain percentage of the fair market value that is determined by local assessors to be the total taxable value of land and additions on the property. | Land | Improvement |
|---|---|---|---|---|
| 2024 | $11,244 | $707,200 | $167,900 | $539,300 |
| 2023 | $10,519 | $577,000 | $134,300 | $442,700 |
| 2022 | $8,430 | $466,500 | $134,300 | $332,200 |
| 2021 | $5,835 | $251,300 | $93,300 | $158,000 |
| 2020 | $5,682 | $251,300 | $93,300 | $158,000 |
| 2019 | $5,468 | $251,300 | $93,300 | $158,000 |
| 2018 | $5,330 | $251,300 | $93,300 | $158,000 |
| 2017 | $5,073 | $196,700 | $75,400 | $121,300 |
| 2016 | $4,931 | $196,700 | $75,400 | $121,300 |
| 2015 | $4,825 | $196,700 | $75,400 | $121,300 |
| 2014 | $4,731 | $196,700 | $75,400 | $121,300 |
Source: Public Records
Map
Nearby Homes