F
Seller's Agent in 2024
Fred D'Aguanno
Derby Properties, Inc.

Estimated Value: $353,000 - $438,000
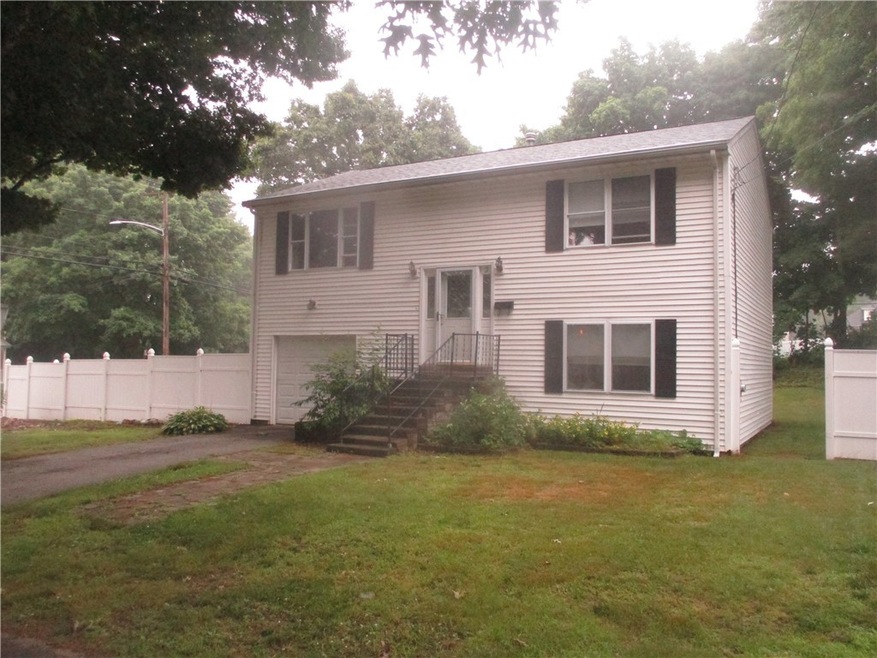
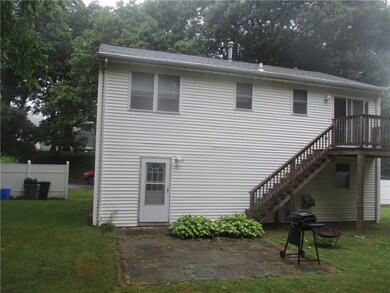
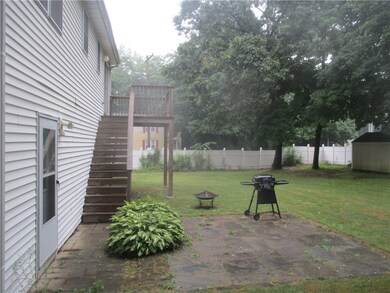
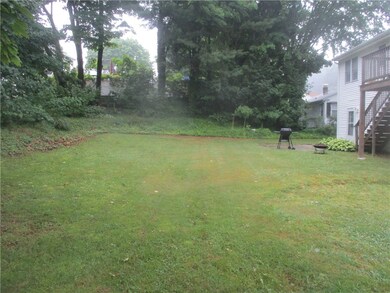
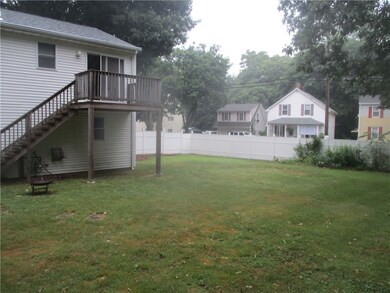
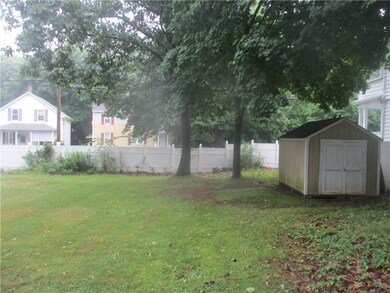
Newer construction! Open concept Raised Ranch! Sunny living room and dinning area! Sliders to a deck! cathedral ceilings! Two bedrooms, one full bath! Lower level has a walkout and room for expansion! Located on an oversized corner lot! Near all!
Last Agent to Sell the Property
Fred D'Aguanno
Derby Properties, Inc. License #REB.0018177 Listed on: 06/21/2024
Last Buyer's Agent
Kyle Seyboth
Century 21 Limitless License #REC.0005226

| Date | Buyer | Sale Price | Title Company |
|---|---|---|---|
| Rodrigues Samantha L | $370,000 | None Available | |
| Rodrigues Samantha L | $370,000 | None Available | |
| Deroy Anthony M | $155,000 | -- | |
| Fnma | $142,500 | -- | |
| Bonaminio Christina | -- | -- | |
| Lucci Christina | $240,000 | -- | |
| Goncalves Natalie | $235,000 | -- | |
| Fnma | $142,500 | -- | |
| Bonaminio Christina | -- | -- | |
| Lucci Christina | $240,000 | -- | |
| Goncalves Natalie | $235,000 | -- |
| Date | Status | Borrower | Loan Amount |
|---|---|---|---|
| Open | Rodrigues Samantha L | $363,298 | |
| Closed | Rodrigues Samantha L | $363,298 | |
| Previous Owner | Goncalves Natalie | $243,450 |
| Date | Event | Price | List to Sale | Price per Sq Ft | Prior Sale |
|---|---|---|---|---|---|
| 11/24/2025 11/24/25 | Off Market | $155,000 | -- | -- | |
| 08/21/2024 08/21/24 | Sold | $370,000 | -2.6% | $249 / Sq Ft | |
| 07/05/2024 07/05/24 | Pending | -- | -- | -- | |
| 06/21/2024 06/21/24 | For Sale | $379,900 | +145.1% | $256 / Sq Ft | |
| 06/30/2016 06/30/16 | Sold | $155,000 | -3.1% | $166 / Sq Ft | View Prior Sale |
| 05/31/2016 05/31/16 | Pending | -- | -- | -- | |
| 05/16/2016 05/16/16 | For Sale | $159,900 | -- | $171 / Sq Ft |
| Year | Tax Paid | Tax Assessment Tax Assessment Total Assessment is a certain percentage of the fair market value that is determined by local assessors to be the total taxable value of land and additions on the property. | Land | Improvement |
|---|---|---|---|---|
| 2025 | $4,686 | $300,000 | $94,100 | $205,900 |
| 2024 | $4,590 | $300,000 | $94,100 | $205,900 |
| 2023 | $4,590 | $300,000 | $94,100 | $205,900 |
| 2022 | $4,443 | $191,200 | $72,300 | $118,900 |
| 2021 | $4,443 | $191,200 | $72,300 | $118,900 |
| 2018 | $4,561 | $165,900 | $56,800 | $109,100 |
| 2016 | $6,034 | $165,900 | $56,800 | $109,100 |
| 2015 | $4,578 | $157,900 | $59,400 | $98,500 |
| 2014 | $4,540 | $157,900 | $59,400 | $98,500 |
| 2013 | $4,540 | $157,900 | $59,400 | $98,500 |
F
Seller's Agent in 2024
Fred D'Aguanno
Derby Properties, Inc.
K
Buyer's Agent in 2024
Kyle Seyboth
Century 21 Limitless
A
Buyer's Agent in 2016
Alfred D'aguanno
Center Place Realty & Investm.
Source: State-Wide MLS
MLS Number: 1362196
APN: JOHN-000003-000000-000039
Disclaimer: Certain information contained herein is derived from information provided by parties other than Homes.com. All information provided is deemed reliable, but is not guaranteed to be accurate and should be independently verified.
![]() IDX information is provided exclusively for personal, non-commercial use, and may not be used for any purpose other than to identify prospective properties consumers may be interested in purchasing. Information is deemed reliable but not guaranteed.
IDX information is provided exclusively for personal, non-commercial use, and may not be used for any purpose other than to identify prospective properties consumers may be interested in purchasing. Information is deemed reliable but not guaranteed.
Copyright © 2026 State-Wide MLS, Inc. All rights reserved.
Ask me questions while you tour the home.