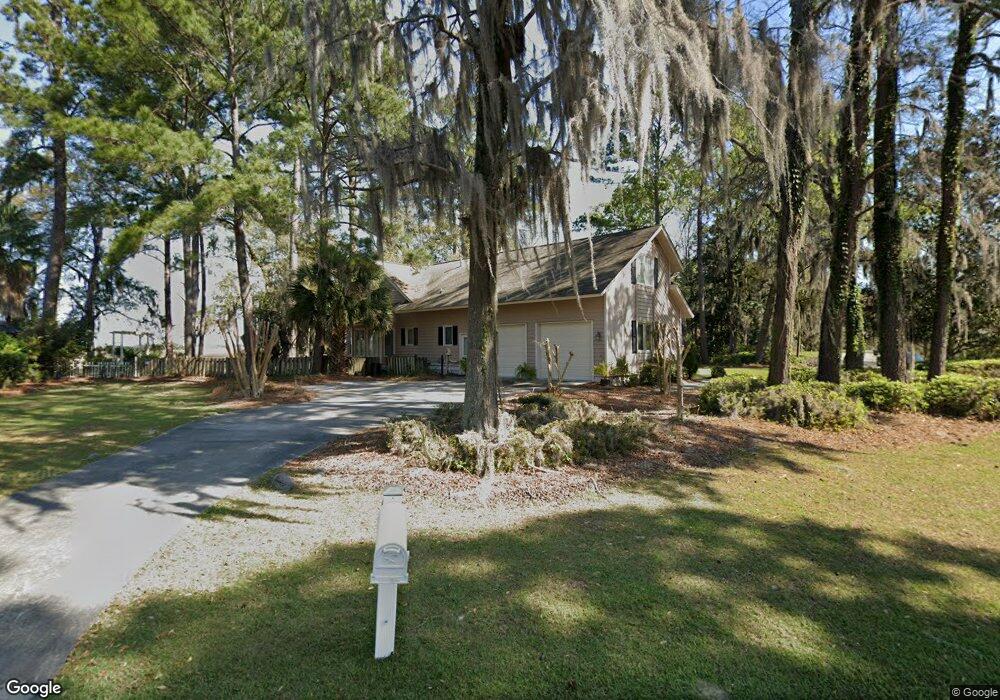
2 Sherborne Ln Savannah, GA 31419
Coffee Bluff-Rose Dhu NeighborhoodEstimated Value: $649,204 - $678,000
4
Beds
3
Baths
2,765
Sq Ft
$242/Sq Ft
Est. Value
About This Home
This home is located at 2 Sherborne Ln, Savannah, GA 31419 and is currently estimated at $669,301, approximately $242 per square foot. 2 Sherborne Ln is a home located in Chatham County with nearby schools including Windsor Forest Elementary School, Windsor Forest High School, and Southwest Middle School.
Ownership History
Date
Name
Owned For
Owner Type
Purchase Details
Closed on
Jun 15, 2015
Sold by
Singh Harpal
Bought by
Brisbane Ernest and Brisbane Awanda
Current Estimated Value
Home Financials for this Owner
Home Financials are based on the most recent Mortgage that was taken out on this home.
Original Mortgage
$350,187
Outstanding Balance
$272,865
Interest Rate
3.92%
Mortgage Type
VA
Estimated Equity
$396,436
Purchase Details
Closed on
Jun 30, 2014
Sold by
2 Sherborne Lane Llc
Bought by
Singh Harpal
Purchase Details
Closed on
Sep 9, 2009
Sold by
Singh Harpal
Bought by
2 Sherborne Lane Llc
Purchase Details
Closed on
Apr 17, 2009
Sold by
2 Sherborne Lane Llc
Bought by
Singh Harpal
Purchase Details
Closed on
Jul 15, 2008
Sold by
Not Provided
Bought by
2 Sherborne Lane Llc <Ea>
Purchase Details
Closed on
Sep 1, 2004
Sold by
Newell E Andrew
Bought by
Cook James L and Cook Heather H
Create a Home Valuation Report for This Property
The Home Valuation Report is an in-depth analysis detailing your home's value as well as a comparison with similar homes in the area
Home Values in the Area
Average Home Value in this Area
Purchase History
| Date | Buyer | Sale Price | Title Company |
|---|---|---|---|
| Brisbane Ernest | $339,000 | -- | |
| Singh Harpal | -- | -- | |
| 2 Sherborne Lane Llc | -- | -- | |
| Singh Harpal | -- | -- | |
| 2 Sherborne Lane Llc <Ea> | -- | -- | |
| Cook James L | $291,500 | -- |
Source: Public Records
Mortgage History
| Date | Status | Borrower | Loan Amount |
|---|---|---|---|
| Open | Brisbane Ernest | $350,187 |
Source: Public Records
Tax History Compared to Growth
Tax History
| Year | Tax Paid | Tax Assessment Tax Assessment Total Assessment is a certain percentage of the fair market value that is determined by local assessors to be the total taxable value of land and additions on the property. | Land | Improvement |
|---|---|---|---|---|
| 2025 | $3,463 | $238,600 | $72,000 | $166,600 |
| 2024 | $3,463 | $238,320 | $72,000 | $166,320 |
| 2023 | $1,180 | $144,760 | $43,200 | $101,560 |
| 2022 | $1,280 | $134,920 | $43,200 | $91,720 |
| 2021 | $4,233 | $130,960 | $43,200 | $87,760 |
| 2020 | $3,013 | $130,960 | $43,200 | $87,760 |
| 2019 | $4,278 | $130,960 | $43,200 | $87,760 |
| 2018 | $2,967 | $127,920 | $43,200 | $84,720 |
| 2017 | $2,688 | $122,240 | $43,200 | $79,040 |
| 2016 | $2,585 | $118,600 | $43,200 | $75,400 |
| 2015 | $5,043 | $120,920 | $43,200 | $77,720 |
| 2014 | $7,782 | $140,320 | $0 | $0 |
Source: Public Records
Map
Nearby Homes
- 15 Sherborne Rd
- 363 Coffee Bluff Villa Rd
- 0 Coffee Bluff Rd Unit SA342739
- 7 Cardiff Rd
- 122 Stonewall Dr
- 111 Stonewall Dr
- 103 Stonewall Dr
- 107 Rose Dhu Way
- 120 Coffee Pointe Dr
- 115 Coffee Pointe Dr
- 21 Rose Hill Dr
- 22 Daveitta Dr
- 143 Arusha Ave
- 4 Arabica Ln
- 47 Rose Hill Dr
- 19 Coffee Pointe Dr
- 13112 Spanish Moss Rd
- 132 Schley Ave
- 13609 Rockingham Rd
- 637 Rose Dhu Rd