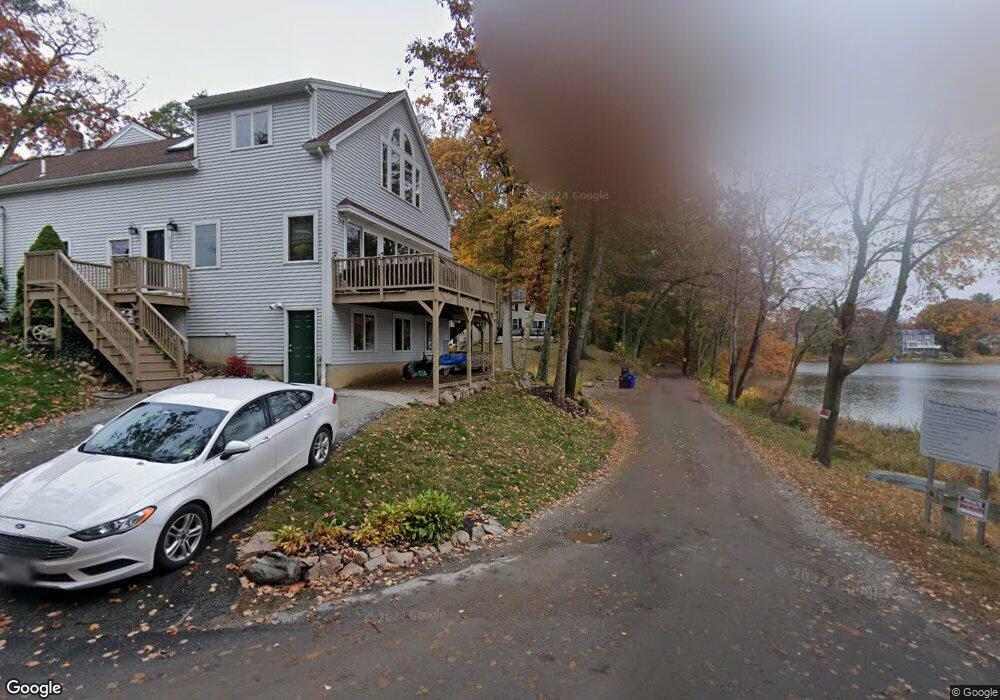
2 South St Wenham, MA 01984
Estimated Value: $709,000 - $886,000
2
Beds
3
Baths
1,765
Sq Ft
$439/Sq Ft
Est. Value
About This Home
This home is located at 2 South St, Wenham, MA 01984 and is currently estimated at $775,370, approximately $439 per square foot. 2 South St is a home located in Essex County with nearby schools including Winthrop School, Cutler Elementary School, and Miles River Middle School.
Ownership History
Date
Name
Owned For
Owner Type
Purchase Details
Closed on
Jan 6, 1999
Sold by
Gauthier Jean E
Bought by
Baker David R
Current Estimated Value
Home Financials for this Owner
Home Financials are based on the most recent Mortgage that was taken out on this home.
Original Mortgage
$115,000
Outstanding Balance
$25,566
Interest Rate
6.8%
Mortgage Type
Purchase Money Mortgage
Estimated Equity
$749,804
Create a Home Valuation Report for This Property
The Home Valuation Report is an in-depth analysis detailing your home's value as well as a comparison with similar homes in the area
Home Values in the Area
Average Home Value in this Area
Purchase History
| Date | Buyer | Sale Price | Title Company |
|---|---|---|---|
| Baker David R | $143,750 | -- | |
| Baker David R | $143,750 | -- |
Source: Public Records
Mortgage History
| Date | Status | Borrower | Loan Amount |
|---|---|---|---|
| Open | Baker David R | $50,000 | |
| Open | Baker David R | $115,000 | |
| Closed | Baker David R | $115,000 |
Source: Public Records
Tax History Compared to Growth
Tax History
| Year | Tax Paid | Tax Assessment Tax Assessment Total Assessment is a certain percentage of the fair market value that is determined by local assessors to be the total taxable value of land and additions on the property. | Land | Improvement |
|---|---|---|---|---|
| 2025 | $9,113 | $586,400 | $296,900 | $289,500 |
| 2024 | $8,900 | $568,300 | $296,900 | $271,400 |
| 2023 | $7,407 | $426,900 | $238,900 | $188,000 |
| 2022 | $8,222 | $419,900 | $238,900 | $181,000 |
| 2021 | $7,905 | $401,700 | $220,700 | $181,000 |
| 2020 | $7,013 | $370,300 | $218,800 | $151,500 |
| 2019 | $6,673 | $370,300 | $218,800 | $151,500 |
| 2018 | $5,314 | $282,800 | $197,600 | $85,200 |
| 2017 | $5,184 | $282,800 | $197,600 | $85,200 |
| 2016 | $4,802 | $282,800 | $197,600 | $85,200 |
| 2015 | $4,596 | $282,800 | $197,600 | $85,200 |
Source: Public Records
Map
Nearby Homes
- 123 Pleasant St
- 20 Longfellow Rd Unit R
- 18 Longfellow Rd
- 113 Pleasant St
- 20R Longfellow Rd
- 107 Pleasant St
- 22 Longfellow Rd
- 16 Longfellow Rd
- 109 Pleasant St
- 6 South St
- 125 Pleasant St
- 3 South St
- 105 Bryant St
- 10 Longfellow Rd
- 5 South St
- 14 Longfellow Rd
- 12 Longfellow Rd
- 40 Batchelder Park
- 17 Longfellow Rd
- 8 South St