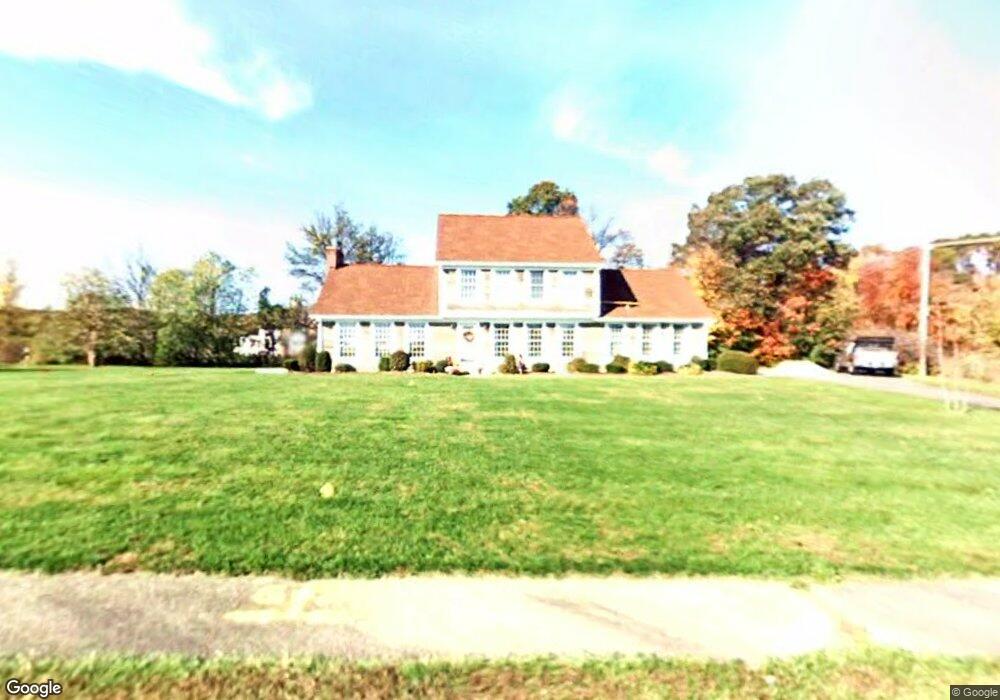
2 Spring Meadows South Hadley, MA 01075
Estimated Value: $548,106 - $621,000
3
Beds
3
Baths
1,946
Sq Ft
$301/Sq Ft
Est. Value
About This Home
This home is located at 2 Spring Meadows, South Hadley, MA 01075 and is currently estimated at $585,777, approximately $301 per square foot. 2 Spring Meadows is a home located in Hampshire County with nearby schools including Plains Elementary School, Mosier Elementary School, and Michael E. Smith Middle School.
Ownership History
Date
Name
Owned For
Owner Type
Purchase Details
Closed on
Jun 13, 2007
Sold by
Mengel Paul O
Bought by
Mcdermott Karyn L and Mcdermott Todd M
Current Estimated Value
Home Financials for this Owner
Home Financials are based on the most recent Mortgage that was taken out on this home.
Original Mortgage
$220,000
Interest Rate
6.19%
Mortgage Type
Purchase Money Mortgage
Purchase Details
Closed on
Aug 29, 2003
Sold by
Mallalieu Richard G and Mallalieu Margaret J
Bought by
Mengel Paul O
Home Financials for this Owner
Home Financials are based on the most recent Mortgage that was taken out on this home.
Original Mortgage
$235,000
Interest Rate
5.69%
Mortgage Type
Purchase Money Mortgage
Purchase Details
Closed on
Jun 29, 1990
Sold by
Spring Patrick J
Bought by
Mallalieu Richard G
Create a Home Valuation Report for This Property
The Home Valuation Report is an in-depth analysis detailing your home's value as well as a comparison with similar homes in the area
Home Values in the Area
Average Home Value in this Area
Purchase History
| Date | Buyer | Sale Price | Title Company |
|---|---|---|---|
| Mcdermott Karyn L | $350,000 | -- | |
| Mengel Paul O | $329,900 | -- | |
| Mallalieu Richard G | $234,000 | -- |
Source: Public Records
Mortgage History
| Date | Status | Borrower | Loan Amount |
|---|---|---|---|
| Open | Mallalieu Richard G | $255,550 | |
| Closed | Mcdermott Karyn L | $220,000 | |
| Previous Owner | Mallalieu Richard G | $47,900 | |
| Previous Owner | Mallalieu Richard G | $235,000 |
Source: Public Records
Tax History
| Year | Tax Paid | Tax Assessment Tax Assessment Total Assessment is a certain percentage of the fair market value that is determined by local assessors to be the total taxable value of land and additions on the property. | Land | Improvement |
|---|---|---|---|---|
| 2025 | $7,940 | $498,400 | $142,400 | $356,000 |
| 2024 | $7,747 | $465,300 | $133,000 | $332,300 |
| 2023 | $7,334 | $417,900 | $120,900 | $297,000 |
| 2022 | $6,943 | $375,700 | $120,900 | $254,800 |
| 2021 | $2,993 | $352,300 | $113,300 | $239,000 |
| 2020 | $6,355 | $318,700 | $113,300 | $205,400 |
| 2019 | $6,615 | $328,300 | $107,800 | $220,500 |
| 2018 | $6,340 | $318,100 | $104,800 | $213,300 |
| 2017 | $2,619 | $302,700 | $104,800 | $197,900 |
| 2016 | $5,995 | $302,000 | $95,700 | $206,300 |
| 2015 | $5,686 | $293,400 | $92,900 | $200,500 |
Source: Public Records
Map
Nearby Homes
- 4 Sunrise Cir
- 214 Alvord Place
- Lot 1 Edgewater Ln
- 77 Ferry St
- 457 Northampton St
- 12 Sycamore Parc
- 11 Hadley St
- 120 Camden St
- 41 Woodbridge St
- 73 Lyman St
- 67 Boynton Ave
- 25 Woodbridge Terrace
- 4 Broad St
- 10 Young Cir
- 5 Olde Plains Hollow
- 43 W Summit St Unit A10
- 289 Morgan St
- 293 Morgan St
- 540 Granby Rd Unit 72A
- 540 Granby Rd Unit 77C
- 4 Spring Meadows
- 31 Alvord St
- 1 Spring Meadows
- 3 Spring Meadows
- 6 Spring Meadows
- 5 Spring Meadows
- 35 Alvord St
- 8 Spring Meadows
- 7 Spring Meadows
- 37 Alvord St
- 39 Alvord St
- 10 Spring Meadows
- 9 Spring Meadows
- 30 Alvord St Unit 1
- 30 Alvord St
- 26 Alvord St
- 2 River Lodge Rd
- 12 Spring Meadows
- 23 Alvord St
- 4 River Lodge Rd
Your Personal Tour Guide
Ask me questions while you tour the home.