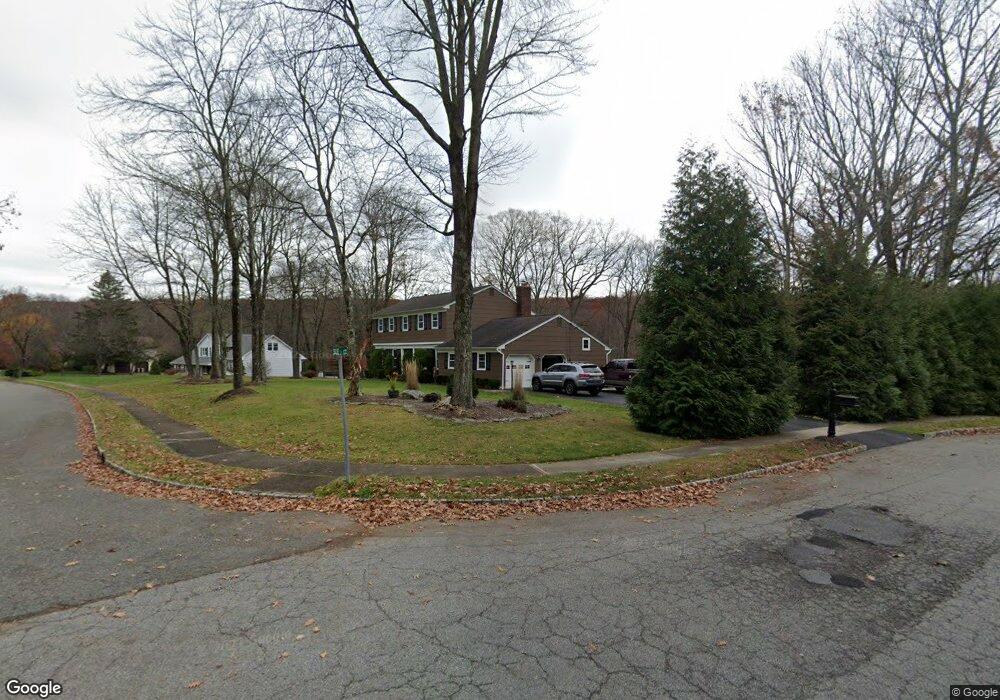
2 Sue Ct Flanders, NJ 07836
Estimated Value: $673,836 - $725,000
--
Bed
--
Bath
2,427
Sq Ft
$284/Sq Ft
Est. Value
About This Home
This home is located at 2 Sue Ct, Flanders, NJ 07836 and is currently estimated at $690,209, approximately $284 per square foot. 2 Sue Ct is a home located in Morris County with nearby schools including Lincoln Roosevelt Elementary School, Eisenhower Middle School, and Roxbury High School.
Ownership History
Date
Name
Owned For
Owner Type
Purchase Details
Closed on
Sep 12, 2005
Sold by
Margolin Julia
Bought by
Wanamaker Craig and Wanamaker Jacqueline
Current Estimated Value
Home Financials for this Owner
Home Financials are based on the most recent Mortgage that was taken out on this home.
Original Mortgage
$280,000
Interest Rate
5.85%
Mortgage Type
Purchase Money Mortgage
Create a Home Valuation Report for This Property
The Home Valuation Report is an in-depth analysis detailing your home's value as well as a comparison with similar homes in the area
Home Values in the Area
Average Home Value in this Area
Purchase History
| Date | Buyer | Sale Price | Title Company |
|---|---|---|---|
| Wanamaker Craig | $450,000 | -- |
Source: Public Records
Mortgage History
| Date | Status | Borrower | Loan Amount |
|---|---|---|---|
| Previous Owner | Wanamaker Craig | $280,000 |
Source: Public Records
Tax History Compared to Growth
Tax History
| Year | Tax Paid | Tax Assessment Tax Assessment Total Assessment is a certain percentage of the fair market value that is determined by local assessors to be the total taxable value of land and additions on the property. | Land | Improvement |
|---|---|---|---|---|
| 2025 | $11,642 | $423,500 | $132,300 | $291,200 |
| 2024 | $11,460 | $423,500 | $132,300 | $291,200 |
| 2023 | $11,460 | $423,500 | $132,300 | $291,200 |
| 2022 | $11,155 | $423,500 | $132,300 | $291,200 |
| 2021 | $11,155 | $423,500 | $132,300 | $291,200 |
| 2020 | $11,134 | $423,500 | $132,300 | $291,200 |
| 2019 | $10,926 | $423,500 | $132,300 | $291,200 |
| 2018 | $10,577 | $245,400 | $74,800 | $170,600 |
| 2017 | $10,520 | $245,400 | $74,800 | $170,600 |
| 2016 | $10,314 | $245,400 | $74,800 | $170,600 |
| 2015 | $10,059 | $245,400 | $74,800 | $170,600 |
| 2014 | $9,899 | $245,400 | $74,800 | $170,600 |
Source: Public Records
Map
Nearby Homes
- 120 Us Highway 206
- 1 Kenneth Terrace
- 18 Chestnut Way
- 33 Carlton Rd
- 6 Glenn Dr
- 146 U S Highway 206
- 8 Stark Ct
- 11 Stark Ct
- 150 U S Highway 206
- 24 Ramar St
- 6 Mountain Ave
- 32 Radcliffe Dr
- 17 Scarborough Ct
- 4 Fern Ct
- 6 Perin Place
- 66 Lamerson Cir
- 81 Clinton Ave
- 23 Hillside Ave
- 66 Whisper Way E
- 6 Cornell Dr