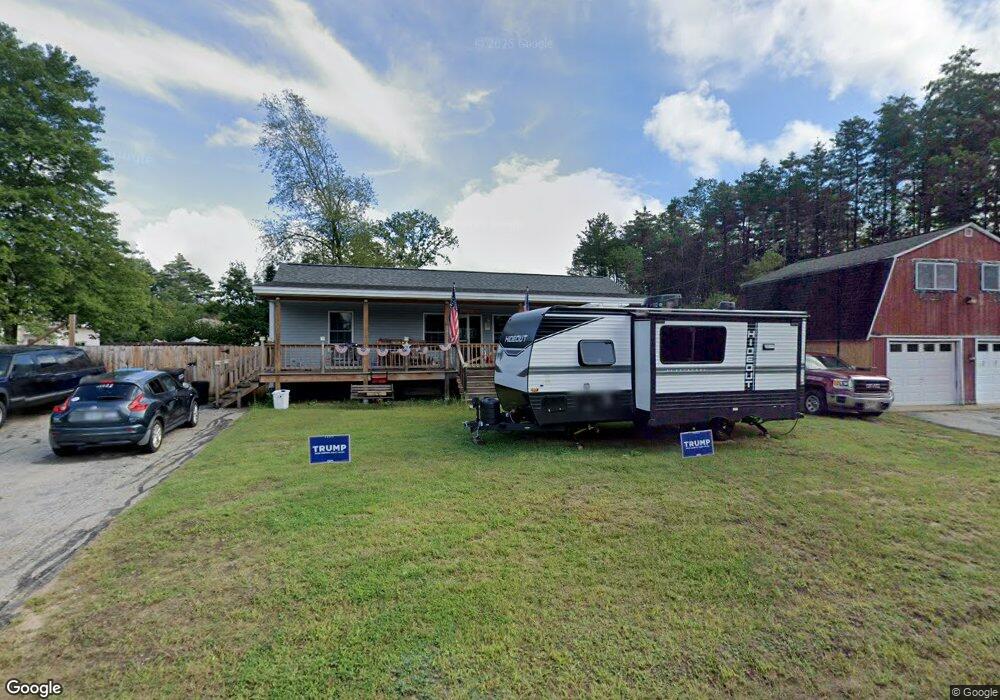
2 Summers Ave Allenstown, NH 03275
Estimated Value: $333,000 - $407,000
1
Bed
1
Bath
1,280
Sq Ft
$288/Sq Ft
Est. Value
About This Home
This home is located at 2 Summers Ave, Allenstown, NH 03275 and is currently estimated at $368,358, approximately $287 per square foot. 2 Summers Ave is a home located in Merrimack County with nearby schools including Allenstown Elementary School, Armand R. Dupont School, and Tender Years Child Care & Learning Center.
Ownership History
Date
Name
Owned For
Owner Type
Purchase Details
Closed on
Aug 5, 2005
Sold by
Albert Wayne F and Albert Mary E
Bought by
Bouley Eric S and Bouley Cheryl A
Current Estimated Value
Home Financials for this Owner
Home Financials are based on the most recent Mortgage that was taken out on this home.
Original Mortgage
$193,030
Outstanding Balance
$39,229
Interest Rate
5.63%
Estimated Equity
$329,129
Create a Home Valuation Report for This Property
The Home Valuation Report is an in-depth analysis detailing your home's value as well as a comparison with similar homes in the area
Home Values in the Area
Average Home Value in this Area
Purchase History
| Date | Buyer | Sale Price | Title Company |
|---|---|---|---|
| Bouley Eric S | $199,000 | -- | |
| Bouley Eric S | $199,000 | -- |
Source: Public Records
Mortgage History
| Date | Status | Borrower | Loan Amount |
|---|---|---|---|
| Open | Bouley Eric S | $193,030 | |
| Closed | Bouley Eric S | $193,030 |
Source: Public Records
Tax History Compared to Growth
Tax History
| Year | Tax Paid | Tax Assessment Tax Assessment Total Assessment is a certain percentage of the fair market value that is determined by local assessors to be the total taxable value of land and additions on the property. | Land | Improvement |
|---|---|---|---|---|
| 2024 | $7,669 | $301,700 | $146,700 | $155,000 |
| 2023 | $6,396 | $301,700 | $146,700 | $155,000 |
| 2022 | $5,883 | $301,700 | $146,700 | $155,000 |
| 2021 | $5,925 | $188,100 | $86,200 | $101,900 |
| 2020 | $5,511 | $188,100 | $86,200 | $101,900 |
| 2019 | $5,850 | $188,100 | $86,200 | $101,900 |
| 2018 | $5,671 | $188,100 | $86,200 | $101,900 |
| 2017 | $5,940 | $185,000 | $86,200 | $98,800 |
| 2016 | $5,749 | $169,800 | $58,300 | $111,500 |
| 2015 | $5,355 | $163,100 | $58,300 | $104,800 |
| 2014 | $5,510 | $163,100 | $58,300 | $104,800 |
| 2013 | $5,272 | $167,200 | $58,300 | $108,900 |
Source: Public Records
Map
Nearby Homes
- 9 Pine Acres Rd
- 307 Dearborn Rd
- 5 Catamount Hill Dr
- 1 Jefferson Ave
- 101 4th Range Rd Unit 4
- 11 Presidential Dr
- 6 Jackson Ave
- 8 Bush Ave
- 43 Catamount Hill Dr
- 233 Pembroke St
- 1 1/2 Bartlett St
- 111 Glass St
- 19 Sullivan Dr
- 259 Pembroke St
- 12-14 Church St Unit 12,14
- 10 Lane Dr
- 2 Cheryl Dr
- 100 Main St Unit M10
- 100 Main St Unit 204
- 422 Dawn Dr Unit 23
- 16 Pine Acres Rd
- 4 Summers Ave
- 18 Pine Acres Rd
- 6 Summers Ave
- 14 Pine Acres Rd
- 7 Summers Ave
- 20 Pine Acres Rd
- 21 Pine Acres Rd
- 9 Summers Ave
- 8 Summers Ave
- 10 Summers Ave
- 15 Pine Acres Rd
- 19 Pine Acres Rd
- 23 Pine Acres Rd
- 7 Albin Ave
- 11 Summers Ave
- 12 Albin Ave
- 5 Albin Ave
- 19 Albin Ave
- 13 Pine Acres Rd