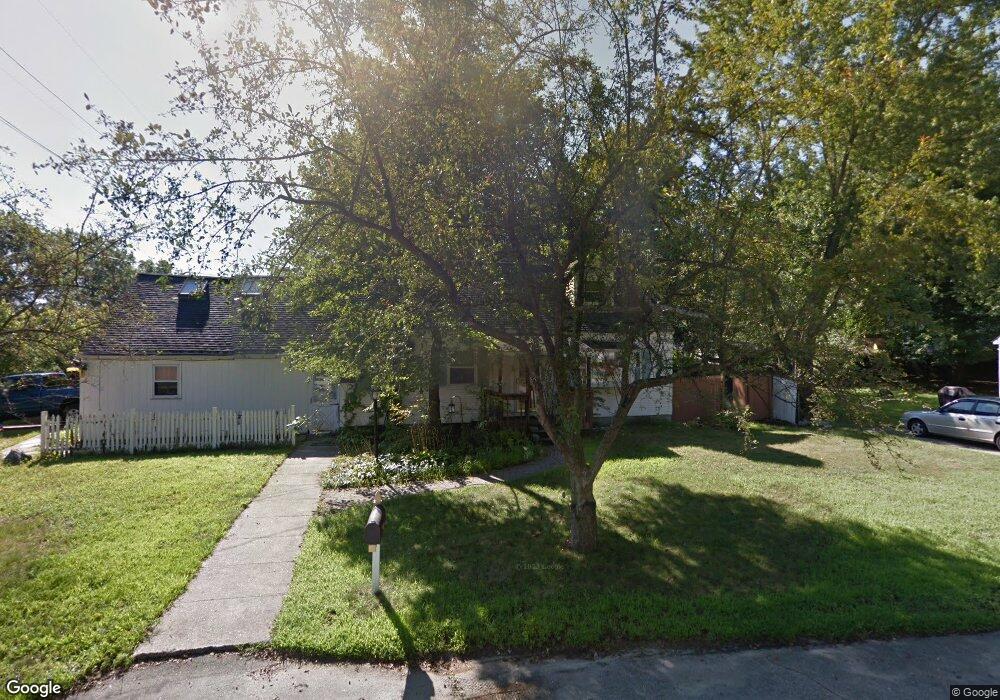
2 Surrey Ln Nashua, NH 03062
Southwest Nashua NeighborhoodEstimated Value: $585,000 - $714,000
5
Beds
2
Baths
2,604
Sq Ft
$241/Sq Ft
Est. Value
About This Home
This home is located at 2 Surrey Ln, Nashua, NH 03062 and is currently estimated at $626,532, approximately $240 per square foot. 2 Surrey Ln is a home located in Hillsborough County with nearby schools including New Searles School, Fairgrounds Middle School, and Nashua High School South.
Ownership History
Date
Name
Owned For
Owner Type
Purchase Details
Closed on
Nov 23, 1998
Sold by
Gault Anne Marie
Bought by
Parsons John B
Current Estimated Value
Home Financials for this Owner
Home Financials are based on the most recent Mortgage that was taken out on this home.
Original Mortgage
$120,150
Interest Rate
6.49%
Mortgage Type
Purchase Money Mortgage
Create a Home Valuation Report for This Property
The Home Valuation Report is an in-depth analysis detailing your home's value as well as a comparison with similar homes in the area
Home Values in the Area
Average Home Value in this Area
Purchase History
| Date | Buyer | Sale Price | Title Company |
|---|---|---|---|
| Parsons John B | $126,500 | -- |
Source: Public Records
Mortgage History
| Date | Status | Borrower | Loan Amount |
|---|---|---|---|
| Open | Parsons John B | $35,000 | |
| Open | Parsons John B | $122,700 | |
| Closed | Parsons John B | $120,150 |
Source: Public Records
Tax History
| Year | Tax Paid | Tax Assessment Tax Assessment Total Assessment is a certain percentage of the fair market value that is determined by local assessors to be the total taxable value of land and additions on the property. | Land | Improvement |
|---|---|---|---|---|
| 2024 | $8,274 | $520,400 | $165,500 | $354,900 |
| 2023 | $7,797 | $427,700 | $132,400 | $295,300 |
| 2022 | $7,729 | $427,700 | $132,400 | $295,300 |
| 2021 | $6,239 | $268,700 | $88,300 | $180,400 |
| 2020 | $6,075 | $268,700 | $88,300 | $180,400 |
| 2019 | $5,847 | $268,700 | $88,300 | $180,400 |
| 2018 | $5,699 | $268,700 | $88,300 | $180,400 |
| 2017 | $6,063 | $235,100 | $68,600 | $166,500 |
| 2016 | $5,894 | $235,100 | $68,600 | $166,500 |
| 2015 | $5,767 | $235,100 | $68,600 | $166,500 |
| 2014 | $5,654 | $235,100 | $68,600 | $166,500 |
Source: Public Records
Map
Nearby Homes
- 29 Nottingham Dr
- 4 Henry David Dr Unit 203
- 4 Henry David Dr Unit 202
- 8 Meadowbrook Dr
- 25 Kern Dr Unit 25
- 22 Kern Dr
- 154 Westwood Dr
- 288 Main Dunstable Rd
- 130 Westwood Dr
- 32 Fairview Ave
- 97 Linwood St
- 5 Wilderness Dr
- 10 Woodfield St
- 27 Wason Ave
- 244 Harris Rd
- 72 Linwood St
- 14 Millbrook Dr
- 17 Herrick St
- 247 Main Dunstable Rd
- 24 Shadwell Rd
Your Personal Tour Guide
Ask me questions while you tour the home.