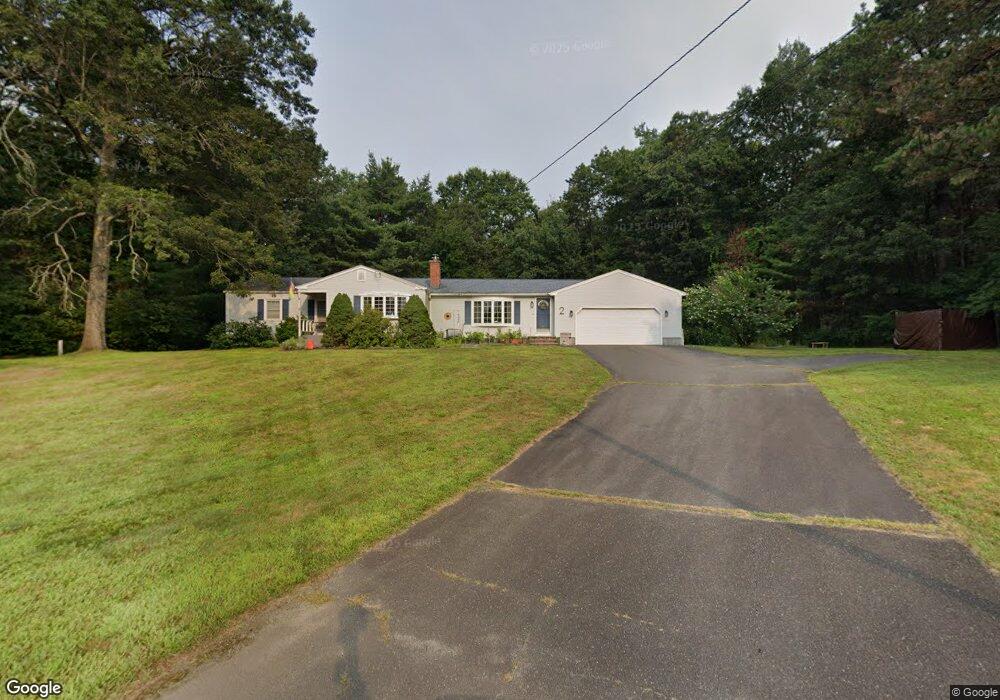
2 Swasey Dr Wilbraham, MA 01095
Estimated Value: $444,143 - $527,000
3
Beds
2
Baths
1,683
Sq Ft
$284/Sq Ft
Est. Value
About This Home
This home is located at 2 Swasey Dr, Wilbraham, MA 01095 and is currently estimated at $477,786, approximately $283 per square foot. 2 Swasey Dr is a home located in Hampden County with nearby schools including Minnechaug Regional High School and Wilbraham & Monson Academy.
Ownership History
Date
Name
Owned For
Owner Type
Purchase Details
Closed on
Feb 18, 2020
Sold by
Meunier Michael P
Bought by
Meunier Amy H
Current Estimated Value
Home Financials for this Owner
Home Financials are based on the most recent Mortgage that was taken out on this home.
Original Mortgage
$132,300
Outstanding Balance
$89,793
Interest Rate
3.6%
Mortgage Type
New Conventional
Estimated Equity
$387,993
Purchase Details
Closed on
Jun 30, 2017
Sold by
Ross Richard and Ross Nancy
Bought by
Meunier Michael P and Meunier Amy H
Home Financials for this Owner
Home Financials are based on the most recent Mortgage that was taken out on this home.
Original Mortgage
$163,322
Interest Rate
4.02%
Mortgage Type
New Conventional
Purchase Details
Closed on
Oct 7, 1983
Bought by
Ross Richard and Ross Nancy
Create a Home Valuation Report for This Property
The Home Valuation Report is an in-depth analysis detailing your home's value as well as a comparison with similar homes in the area
Home Values in the Area
Average Home Value in this Area
Purchase History
| Date | Buyer | Sale Price | Title Company |
|---|---|---|---|
| Meunier Amy H | -- | None Available | |
| Meunier Michael P | $273,000 | -- | |
| Ross Richard | -- | -- |
Source: Public Records
Mortgage History
| Date | Status | Borrower | Loan Amount |
|---|---|---|---|
| Open | Meunier Amy H | $132,300 | |
| Previous Owner | Meunier Michael P | $163,322 | |
| Previous Owner | Ross Richard | $103,200 | |
| Previous Owner | Ross Richard | $25,000 |
Source: Public Records
Tax History Compared to Growth
Tax History
| Year | Tax Paid | Tax Assessment Tax Assessment Total Assessment is a certain percentage of the fair market value that is determined by local assessors to be the total taxable value of land and additions on the property. | Land | Improvement |
|---|---|---|---|---|
| 2025 | $7,247 | $405,300 | $96,400 | $308,900 |
| 2024 | $7,622 | $412,000 | $96,400 | $315,600 |
| 2023 | $6,766 | $381,700 | $96,400 | $285,300 |
| 2022 | $6,766 | $330,200 | $96,400 | $233,800 |
| 2021 | $6,509 | $283,500 | $105,200 | $178,300 |
| 2020 | $6,345 | $283,500 | $105,200 | $178,300 |
| 2019 | $6,180 | $283,500 | $105,200 | $178,300 |
| 2018 | $5,791 | $255,800 | $105,200 | $150,600 |
| 2017 | $5,007 | $227,600 | $105,200 | $122,400 |
| 2016 | $4,761 | $220,400 | $111,400 | $109,000 |
| 2015 | $4,602 | $220,400 | $111,400 | $109,000 |
Source: Public Records
Map
Nearby Homes
- 6 Katie St
- 390 Soule Rd
- 1028 Tinkham Rd
- 460 Soule Rd
- 59 Baldwin Dr
- 374
- 27 Eastwood Dr
- 19 Forest Hill Rd
- 25 Angelica Dr
- 767 Stony Hill Rd
- 230V Burleigh Rd
- 85 Brookhaven Dr
- 763 Stony Hill Rd
- 760 Stony Hill Rd
- 14 Brookdale Dr
- 98 Brookhaven Dr
- 5 Edgewood Rd
- 500 Springfield St
- 331 Grand Valley Rd
- 226 Allen St