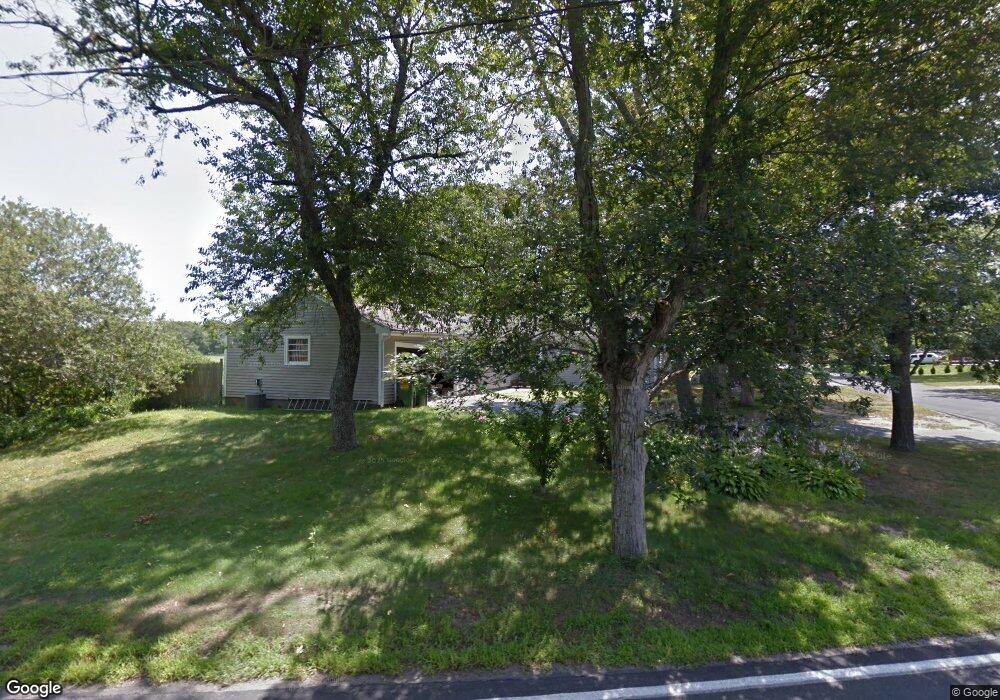
2 Sylvan Way South Yarmouth, MA 02664
Estimated Value: $572,000 - $749,000
3
Beds
2
Baths
1,801
Sq Ft
$372/Sq Ft
Est. Value
About This Home
This home is located at 2 Sylvan Way, South Yarmouth, MA 02664 and is currently estimated at $669,894, approximately $371 per square foot. 2 Sylvan Way is a home located in Barnstable County with nearby schools including Dennis-Yarmouth Regional High School and St. Pius X. School.
Ownership History
Date
Name
Owned For
Owner Type
Purchase Details
Closed on
Mar 23, 2020
Sold by
Donnelly Catherine A and Roberts Susan M
Bought by
2 Sylvan Way T
Current Estimated Value
Purchase Details
Closed on
May 1, 1995
Sold by
Mcelhaney Jean M and Mcelhaney Joan A
Bought by
Roberts Susan M and Donnelly Catherine A
Home Financials for this Owner
Home Financials are based on the most recent Mortgage that was taken out on this home.
Original Mortgage
$79,200
Interest Rate
8.33%
Mortgage Type
Purchase Money Mortgage
Create a Home Valuation Report for This Property
The Home Valuation Report is an in-depth analysis detailing your home's value as well as a comparison with similar homes in the area
Home Values in the Area
Average Home Value in this Area
Purchase History
| Date | Buyer | Sale Price | Title Company |
|---|---|---|---|
| 2 Sylvan Way T | -- | None Available | |
| Roberts Susan M | $99,000 | -- |
Source: Public Records
Mortgage History
| Date | Status | Borrower | Loan Amount |
|---|---|---|---|
| Previous Owner | Roberts Susan M | $40,000 | |
| Previous Owner | Roberts Susan M | $73,800 | |
| Previous Owner | Roberts Susan M | $79,200 |
Source: Public Records
Tax History Compared to Growth
Tax History
| Year | Tax Paid | Tax Assessment Tax Assessment Total Assessment is a certain percentage of the fair market value that is determined by local assessors to be the total taxable value of land and additions on the property. | Land | Improvement |
|---|---|---|---|---|
| 2025 | $4,618 | $652,300 | $165,000 | $487,300 |
| 2024 | $4,358 | $590,500 | $143,500 | $447,000 |
| 2023 | $4,275 | $527,100 | $130,400 | $396,700 |
| 2022 | $4,037 | $439,800 | $124,500 | $315,300 |
| 2021 | $3,631 | $379,800 | $124,500 | $255,300 |
| 2020 | $3,687 | $368,700 | $131,800 | $236,900 |
| 2019 | $3,373 | $334,000 | $131,800 | $202,200 |
| 2018 | $3,210 | $312,000 | $109,800 | $202,200 |
| 2017 | $3,126 | $312,000 | $109,800 | $202,200 |
| 2016 | $3,026 | $303,200 | $101,000 | $202,200 |
| 2015 | $2,854 | $284,300 | $96,600 | $187,700 |
Source: Public Records
Map
Nearby Homes