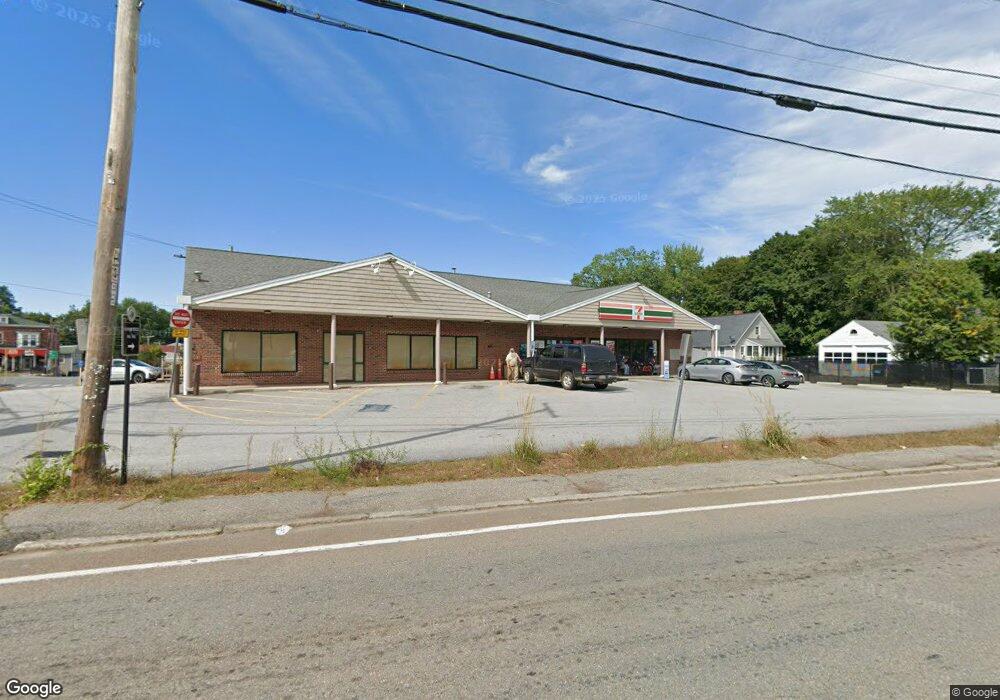
2 Tarbell St Pepperell, MA 01463
Estimated Value: $2,746,819
4
Beds
4
Baths
2,000
Sq Ft
$1,373/Sq Ft
Est. Value
About This Home
This home is located at 2 Tarbell St, Pepperell, MA 01463 and is currently estimated at $2,746,819, approximately $1,373 per square foot. 2 Tarbell St is a home located in Middlesex County with nearby schools including North Middlesex Regional High School, Pepperell Christian Academy, and Maple Dene & Moppet School.
Ownership History
Date
Name
Owned For
Owner Type
Purchase Details
Closed on
Dec 18, 2014
Sold by
Linear Retail Pepperel
Bought by
Rea Priyanka Pepperell
Current Estimated Value
Home Financials for this Owner
Home Financials are based on the most recent Mortgage that was taken out on this home.
Original Mortgage
$1,031,250
Interest Rate
4.02%
Mortgage Type
Commercial
Purchase Details
Closed on
Nov 2, 2006
Sold by
New England Pantry Inc
Bought by
Linear Retail Pepperel
Purchase Details
Closed on
Jun 13, 2001
Sold by
Whp Exchange Llc
Bought by
Whp Lp
Home Financials for this Owner
Home Financials are based on the most recent Mortgage that was taken out on this home.
Original Mortgage
$813,000
Interest Rate
7.15%
Mortgage Type
Commercial
Purchase Details
Closed on
Oct 17, 1994
Sold by
Prescott Assoc
Bought by
White Hen Pantry Inc
Create a Home Valuation Report for This Property
The Home Valuation Report is an in-depth analysis detailing your home's value as well as a comparison with similar homes in the area
Home Values in the Area
Average Home Value in this Area
Purchase History
| Date | Buyer | Sale Price | Title Company |
|---|---|---|---|
| Rea Priyanka Pepperell | $1,375,000 | -- | |
| Linear Retail Pepperel | $900,000 | -- | |
| Whp Lp | $620,000 | -- | |
| White Hen Pantry Inc | $402,500 | -- |
Source: Public Records
Mortgage History
| Date | Status | Borrower | Loan Amount |
|---|---|---|---|
| Closed | Rea Priyanka Pepperell | $1,031,250 | |
| Previous Owner | White Hen Pantry Inc | $813,000 | |
| Previous Owner | White Hen Pantry Inc | $344,250 |
Source: Public Records
Tax History Compared to Growth
Tax History
| Year | Tax Paid | Tax Assessment Tax Assessment Total Assessment is a certain percentage of the fair market value that is determined by local assessors to be the total taxable value of land and additions on the property. | Land | Improvement |
|---|---|---|---|---|
| 2025 | $16,070 | $1,098,400 | $248,200 | $850,200 |
| 2024 | $15,060 | $1,049,500 | $235,500 | $814,000 |
| 2023 | $15,314 | $1,011,500 | $226,500 | $785,000 |
| 2022 | $15,126 | $882,000 | $199,300 | $682,700 |
| 2021 | $15,805 | $882,000 | $199,300 | $682,700 |
| 2020 | $14,844 | $874,200 | $199,300 | $674,900 |
| 2019 | $13,979 | $842,600 | $181,200 | $661,400 |
| 2018 | $13,810 | $842,600 | $181,200 | $661,400 |
| 2017 | $12,628 | $794,700 | $167,200 | $627,500 |
| 2016 | $13,136 | $794,700 | $167,200 | $627,500 |
| 2015 | $12,400 | $777,400 | $167,200 | $610,200 |
| 2014 | $11,375 | $717,200 | $167,200 | $550,000 |
Source: Public Records
Map
Nearby Homes
- 9 Tarbell St
- 28-30 Groton St
- 38 Tarbell St Unit 5B
- 31 Prospect St
- 4 Parker Hill Way Unit C
- 10 Tucker St
- 35 Hollis St Unit 1
- 38 River Rd Unit 11
- 5 June St
- 208 North St
- 55 Park St
- 24 Unkety Brook Way
- 31 Heald St
- 7 Maureens Way
- 6 Mason St Unit 31
- 139 Nashua Rd
- 147 Nashua Rd
- 8 Jamie Rd
- 142 River Rd
- 7 Birch Hill Rd
- 2 Tarbell St Unit 1
- 2 Tarbell St Unit 3
- 2 Tarbell St Unit 2
- 4 Tarbell St
- 8 Tarbell St
- 8 Tarbell St Unit 10
- 8 Tarbell St Unit 1
- 63 Groton St
- 1 Hotel Place
- 1 Hotel Place Unit 4
- 1 Hotel Place Unit 5
- 1 Hotel Place Unit 10
- 1 Hotel Place Unit 11
- 1 Hotel Place Unit 8
- 1 Hotel Place Unit 6
- 1 Hotel Place Unit 14
- 1 Hotel Place Unit 15
- 1 Hotel Place Unit 9
- 1 Hotel Place Unit 12
- 1 Hotel Place Unit 16