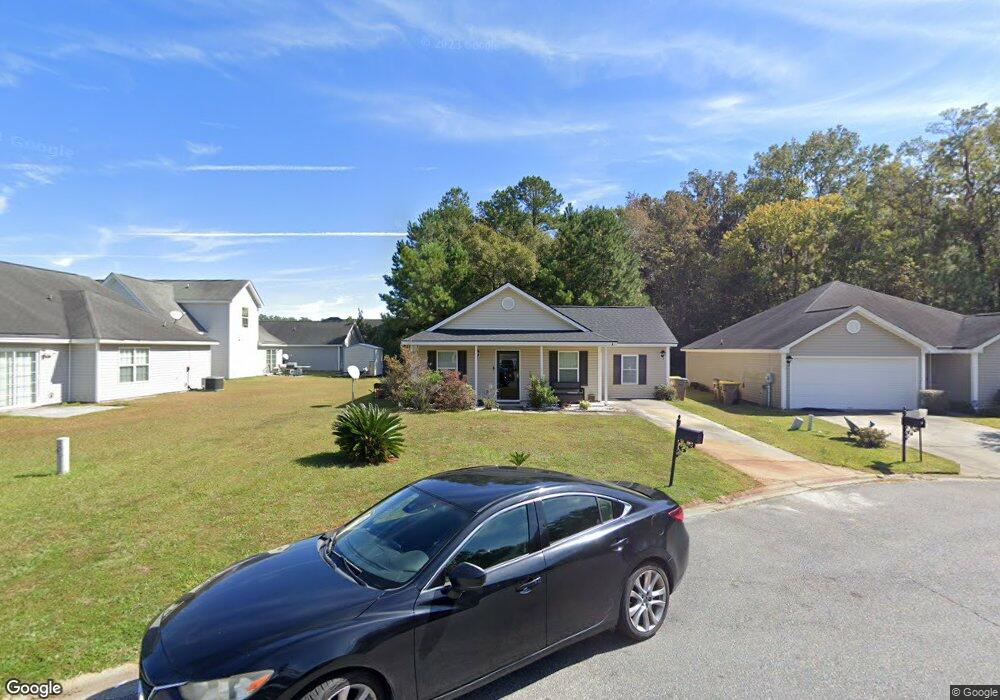
2 Tiller Ct Savannah, GA 31407
Estimated Value: $253,000 - $267,087
3
Beds
2
Baths
1,332
Sq Ft
$195/Sq Ft
Est. Value
About This Home
This home is located at 2 Tiller Ct, Savannah, GA 31407 and is currently estimated at $260,272, approximately $195 per square foot. 2 Tiller Ct is a home located in Chatham County with nearby schools including Rice Creek K-8 School and Groves High School.
Ownership History
Date
Name
Owned For
Owner Type
Purchase Details
Closed on
Aug 31, 2009
Sold by
Fred Williams Homebuillder
Bought by
Moore Sonya
Current Estimated Value
Home Financials for this Owner
Home Financials are based on the most recent Mortgage that was taken out on this home.
Original Mortgage
$120,306
Outstanding Balance
$78,680
Interest Rate
5.19%
Mortgage Type
New Conventional
Estimated Equity
$181,592
Purchase Details
Closed on
Jul 8, 2009
Sold by
Cherokee Nation Llc
Bought by
Fred Williams Homebuillder Inc
Home Financials for this Owner
Home Financials are based on the most recent Mortgage that was taken out on this home.
Original Mortgage
$120,306
Outstanding Balance
$78,680
Interest Rate
5.19%
Mortgage Type
New Conventional
Estimated Equity
$181,592
Purchase Details
Closed on
May 18, 2009
Sold by
New City Development Llc
Bought by
Cherokee Nation Llc
Purchase Details
Closed on
Jul 14, 2005
Sold by
Not Provided
Bought by
Moore Sonya
Create a Home Valuation Report for This Property
The Home Valuation Report is an in-depth analysis detailing your home's value as well as a comparison with similar homes in the area
Home Values in the Area
Average Home Value in this Area
Purchase History
| Date | Buyer | Sale Price | Title Company |
|---|---|---|---|
| Moore Sonya | $117,900 | -- | |
| Fred Williams Homebuillder Inc | $120,000 | -- | |
| Cherokee Nation Llc | -- | -- | |
| Moore Sonya | $555,300 | -- |
Source: Public Records
Mortgage History
| Date | Status | Borrower | Loan Amount |
|---|---|---|---|
| Open | Moore Sonya | $120,306 |
Source: Public Records
Tax History
| Year | Tax Paid | Tax Assessment Tax Assessment Total Assessment is a certain percentage of the fair market value that is determined by local assessors to be the total taxable value of land and additions on the property. | Land | Improvement |
|---|---|---|---|---|
| 2025 | $1,910 | $114,360 | $20,000 | $94,360 |
| 2024 | $12 | $87,600 | $18,000 | $69,600 |
| 2023 | $1,165 | $81,680 | $18,000 | $63,680 |
| 2022 | $1,615 | $65,520 | $8,000 | $57,520 |
| 2021 | $1,608 | $56,920 | $8,000 | $48,920 |
| 2020 | $1,215 | $55,440 | $8,000 | $47,440 |
| 2019 | $1,215 | $40,240 | $8,000 | $32,240 |
| 2018 | $1,232 | $40,240 | $8,000 | $32,240 |
| 2017 | $1,146 | $40,240 | $8,000 | $32,240 |
| 2016 | $1,146 | $40,240 | $8,000 | $32,240 |
| 2015 | $1,148 | $40,240 | $8,000 | $32,240 |
| 2014 | $1,593 | $38,240 | $0 | $0 |
Source: Public Records
Map
Nearby Homes
- 76 Tiller Way
- 7 Corsair Cir
- 24 Transom Rd
- 39 Bearing Cir
- 19 Halyard Dr
- 58 Bearing Cir Unit D
- 640 Meinhard Rd
- 33 Cordage Cir
- 0 Highway 30 Unit SA345863
- 615 Meinhard Rd
- 44 Braxton Manor Dr
- 15 Amber Dr
- 29 Roseberry Cir
- 430 Punkin Bridge Rd
- 147 Fox Glen Ct
- 217 Monteith Rd
- 150 Berrien Rd
- 133 Fox Glen Ct
- 8 Brown Thrasher Ct
- 5 Ponderosa Dr
Your Personal Tour Guide
Ask me questions while you tour the home.