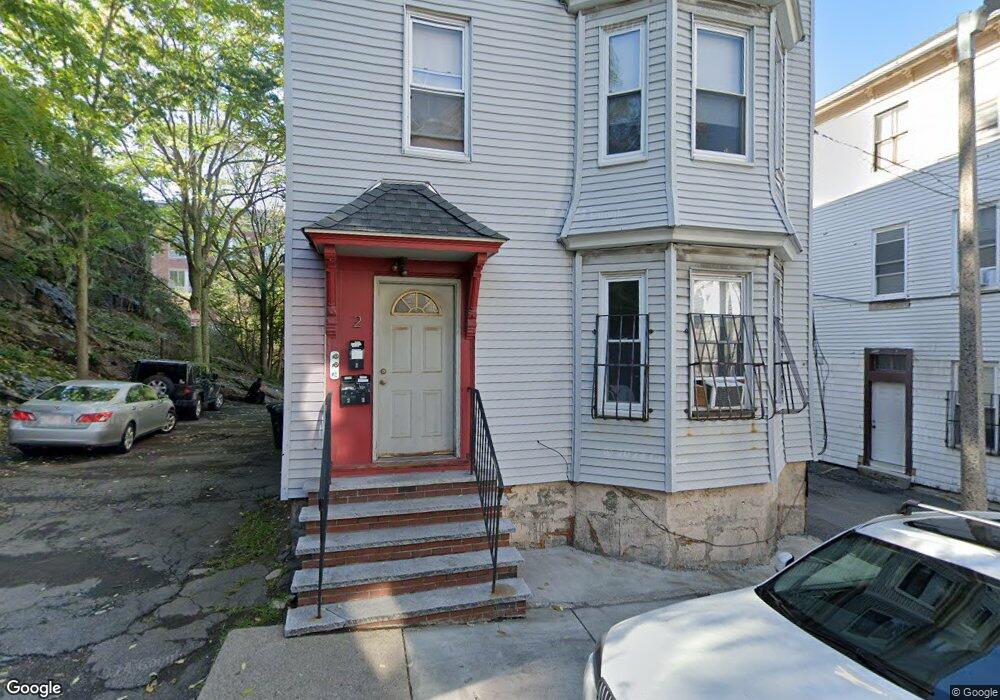
2 Torpie St Roxbury Crossing, MA 02120
Mission Hill NeighborhoodEstimated Value: $1,888,000 - $2,537,000
8
Beds
3
Baths
3,050
Sq Ft
$694/Sq Ft
Est. Value
About This Home
This home is located at 2 Torpie St, Roxbury Crossing, MA 02120 and is currently estimated at $2,115,667, approximately $693 per square foot. 2 Torpie St is a home located in Suffolk County with nearby schools including Manville School and Malik Academy.
Ownership History
Date
Name
Owned For
Owner Type
Purchase Details
Closed on
Apr 1, 1999
Sold by
Kelly James J
Bought by
2 Torpie St Nt and Yianasmidis
Current Estimated Value
Create a Home Valuation Report for This Property
The Home Valuation Report is an in-depth analysis detailing your home's value as well as a comparison with similar homes in the area
Home Values in the Area
Average Home Value in this Area
Purchase History
| Date | Buyer | Sale Price | Title Company |
|---|---|---|---|
| 2 Torpie St Nt | $139,000 | -- |
Source: Public Records
Mortgage History
| Date | Status | Borrower | Loan Amount |
|---|---|---|---|
| Previous Owner | 2 Torpie St Nt | $106,250 | |
| Previous Owner | 2 Torpie St Nt | $86,000 | |
| Previous Owner | 2 Torpie St Nt | $53,700 |
Source: Public Records
Tax History
| Year | Tax Paid | Tax Assessment Tax Assessment Total Assessment is a certain percentage of the fair market value that is determined by local assessors to be the total taxable value of land and additions on the property. | Land | Improvement |
|---|---|---|---|---|
| 2025 | $18,563 | $1,603,000 | $492,900 | $1,110,100 |
| 2024 | $16,993 | $1,559,000 | $466,600 | $1,092,400 |
| 2023 | $16,744 | $1,559,000 | $466,600 | $1,092,400 |
| 2022 | $16,465 | $1,513,300 | $452,900 | $1,060,400 |
| 2021 | $15,234 | $1,427,700 | $427,300 | $1,000,400 |
| 2020 | $14,335 | $1,357,500 | $383,100 | $974,400 |
| 2019 | $13,003 | $1,233,700 | $264,300 | $969,400 |
| 2018 | $11,967 | $1,141,900 | $264,300 | $877,600 |
| 2017 | $11,409 | $1,077,300 | $264,300 | $813,000 |
| 2016 | $10,304 | $936,700 | $264,300 | $672,400 |
| 2015 | $9,727 | $803,200 | $251,000 | $552,200 |
| 2014 | $8,602 | $683,800 | $251,000 | $432,800 |
Source: Public Records
Map
Nearby Homes
- 3 S Whitney St Unit 2
- 91-93 Calumet St
- 7 Oswald St
- 6 Harleston St Unit 6
- 743 Parker St Unit 3
- 18 Eldora St
- 80 Fenwood Rd Unit 706
- 80 Terrace St Unit 501
- 115 Fisher Ave Unit 1
- 134 Terrace St
- 40 Wensley St
- 10 Bucknam St Unit 2
- 884 Huntington Ave
- 28-30 Lawn St Unit 1
- 378 Riverway Unit 3
- 111 Heath St
- 156 Terrace St Unit 402
- 92 Lawn St Unit 7-160
- 100 Lawn St Unit 100
- 6 Parkway Rd Unit 6
- 2 Torpie St Unit 4
- 2 Torpie St Unit 2
- 2 Torpie St
- 2 Torpie St Unit 1
- 2 Torpie St Unit 3
- 1582 Tremont St Unit 3
- 1582 Tremont St
- 1582 Tremont St Unit 2
- 1582 Tremont St Unit 1
- 1584 Tremont St Unit 1
- 1584 Tremont St Unit 3
- 1584 Tremont St
- 1584 Tremont St Unit 2
- 1 Torpie St
- 1 Torpie St Unit 4
- 1 Torpie St
- 1 Torpie St Unit 1
- 1 Torpie St Unit 2
- 1 Torpie St Unit 3
- 1590 Tremont St Unit 2
Your Personal Tour Guide
Ask me questions while you tour the home.