2 Tupelo Dr Hingham, MA 02043
Crow Point NeighborhoodEstimated Value: $1,518,000 - $1,854,000
About This Home
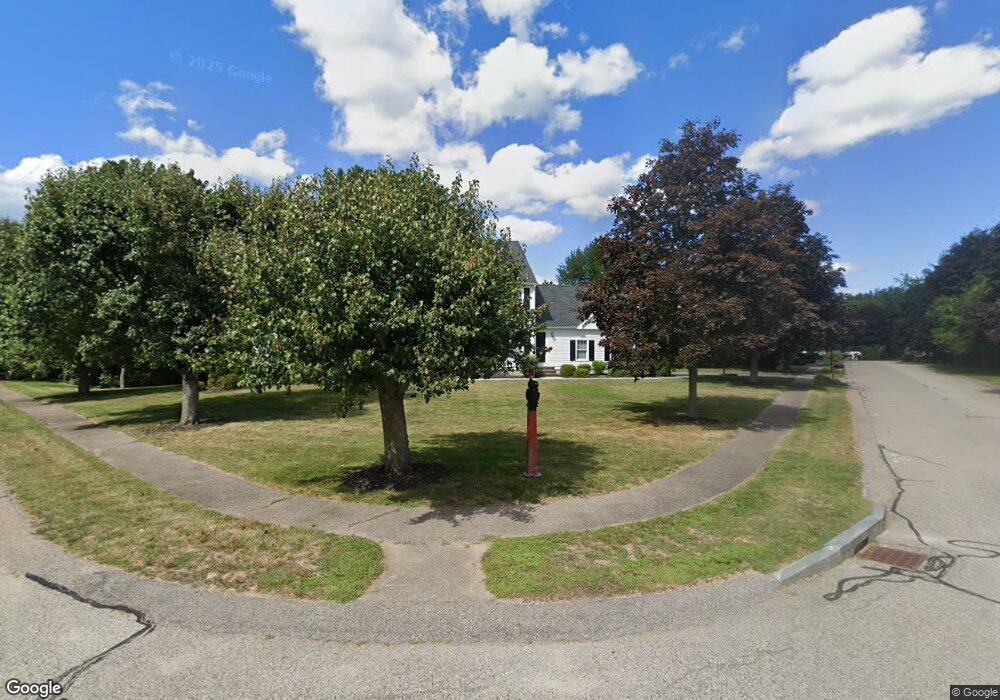
This home is located at 2 Tupelo Dr, Hingham, MA 02043 and is currently estimated at $1,655,764, approximately $644 per square foot. 2 Tupelo Dr is a home located in Plymouth County with nearby schools including William L. Foster Elementary School, Hingham Middle School, and Hingham High School.
Ownership History
We collect this data history from publicly available records. To have your information removed, we recommend requesting removal directly through your county’s website.
Purchase Details
Purchase Details
Purchase Details
Home Values in the Area
Average Home Value in this Area
Purchase History
We collect this data history from publicly available records. To have your information removed, we recommend requesting removal directly through your county’s website.
| Date | Buyer | Sale Price | Title Company |
|---|---|---|---|
| $760,000 | -- | ||
| $760,000 | -- | ||
| $703,000 | -- | ||
| $337,790 | -- |
Mortgage History
We collect this data history from publicly available records. To have your information removed, we recommend requesting removal directly through your county’s website.
| Date | Status | Borrower | Loan Amount |
|---|---|---|---|
| Open | $417,000 | ||
| Closed | $231,995 | ||
| Previous Owner | $570,000 |
Tax History
We collect this data history from publicly available records. To have your information removed, we recommend requesting removal directly through your county’s website.
| Year | Tax Paid | Tax Assessment Tax Assessment Total Assessment is a certain percentage of the fair market value that is determined by local assessors to be the total taxable value of land and additions on the property. | Land | Improvement |
|---|---|---|---|---|
| 2025 | $13,931 | $1,303,200 | $599,200 | $704,000 |
| 2024 | $13,479 | $1,242,300 | $599,200 | $643,100 |
| 2023 | $11,848 | $1,184,800 | $599,200 | $585,600 |
| 2022 | $11,271 | $975,000 | $499,300 | $475,700 |
| 2021 | $8,278 | $954,800 | $520,100 | $434,700 |
| 2020 | $8,185 | $954,800 | $520,100 | $434,700 |
| 2019 | $7,962 | $829,600 | $366,100 | $463,500 |
| 2018 | $7,338 | $829,600 | $366,100 | $463,500 |
| 2017 | $7,268 | $770,600 | $374,500 | $396,100 |
| 2016 | $9,401 | $752,700 | $356,600 | $396,100 |
| 2015 | $9,215 | $735,400 | $339,300 | $396,100 |
Map
- 16 Bradley Woods Dr
- 110 Uss Buckley Place
- 110 Uss Buckley Place Unit 2405
- 103 Buckley Place Unit 2502
- 96 Wompatuck Rd
- 16 Rhodes Place
- 53 Governor Long Rd
- 10 Ocean View Dr
- 60 Thaxter St
- 199 Wompatuck Rd
- 101 Tuckers Ln
- 7 Howe St
- 403 Tuckers Ln Unit 403
- 3 Talbot Rd
- 10 Shipyard Dr Unit 303
- 10 Shipyard Dr Unit 401
- 10 Shipyard Dr Unit 313
- 10 Shipyard Dr Unit 511
- 10 Shipyard Dr Unit 314
- 93 Kimball Beach Rd
Ask me questions while you tour the home.