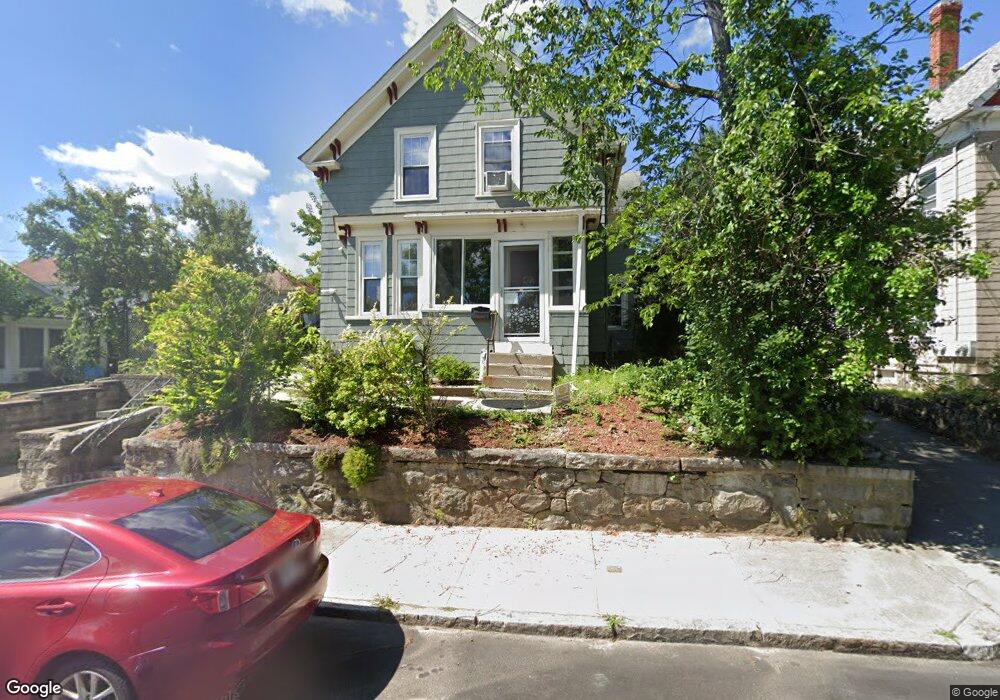
2 Union St Methuen, MA 01844
Downtown Methuen NeighborhoodEstimated Value: $484,119 - $547,000
3
Beds
1
Bath
1,541
Sq Ft
$335/Sq Ft
Est. Value
About This Home
This home is located at 2 Union St, Methuen, MA 01844 and is currently estimated at $515,780, approximately $334 per square foot. 2 Union St is a home located in Essex County with nearby schools including Marsh Grammar School, Methuen High School, and Saint Monica School.
Ownership History
Date
Name
Owned For
Owner Type
Purchase Details
Closed on
Oct 22, 2009
Sold by
Fnma
Bought by
Rossetti Sandra J
Current Estimated Value
Home Financials for this Owner
Home Financials are based on the most recent Mortgage that was taken out on this home.
Original Mortgage
$127,710
Outstanding Balance
$83,097
Interest Rate
5.09%
Mortgage Type
Purchase Money Mortgage
Estimated Equity
$432,684
Purchase Details
Closed on
Jul 17, 2009
Sold by
Jacobson Andrew
Bought by
Federal National Mortgage Association
Purchase Details
Closed on
Oct 25, 1999
Sold by
Pratt Adam B
Bought by
Jacobson Andrew
Purchase Details
Closed on
Sep 30, 1993
Sold by
Hynes Catherine R
Bought by
Pratt Adam B
Create a Home Valuation Report for This Property
The Home Valuation Report is an in-depth analysis detailing your home's value as well as a comparison with similar homes in the area
Home Values in the Area
Average Home Value in this Area
Purchase History
| Date | Buyer | Sale Price | Title Company |
|---|---|---|---|
| Rossetti Sandra J | -- | -- | |
| Rossetti Sandra J | -- | -- | |
| Rossetti Sandra J | -- | -- | |
| Federal National Mortgage Association | $203,662 | -- | |
| Federal National Mortgage Association | $203,662 | -- | |
| Jacobson Andrew | $107,200 | -- | |
| Jacobson Andrew | $107,200 | -- | |
| Pratt Adam B | $81,500 | -- | |
| Pratt Adam B | $81,500 | -- |
Source: Public Records
Mortgage History
| Date | Status | Borrower | Loan Amount |
|---|---|---|---|
| Open | Rossetti Sandra J | $127,710 | |
| Closed | Pratt Adam B | $127,710 |
Source: Public Records
Tax History
| Year | Tax Paid | Tax Assessment Tax Assessment Total Assessment is a certain percentage of the fair market value that is determined by local assessors to be the total taxable value of land and additions on the property. | Land | Improvement |
|---|---|---|---|---|
| 2025 | $4,526 | $427,800 | $185,900 | $241,900 |
| 2024 | $4,392 | $404,400 | $162,500 | $241,900 |
| 2023 | $3,976 | $339,800 | $143,000 | $196,800 |
| 2022 | $3,777 | $289,400 | $117,000 | $172,400 |
| 2021 | $3,539 | $268,300 | $110,500 | $157,800 |
| 2020 | $3,508 | $261,000 | $110,500 | $150,500 |
| 2019 | $3,330 | $234,700 | $104,000 | $130,700 |
| 2018 | $3,154 | $221,000 | $97,500 | $123,500 |
| 2017 | $2,929 | $199,900 | $91,000 | $108,900 |
| 2016 | $2,864 | $193,400 | $84,500 | $108,900 |
| 2015 | $2,700 | $184,900 | $84,500 | $100,400 |
Source: Public Records
Map
Nearby Homes
- 9-11 Horne St
- 24 Railroad St
- 6 Huse Rd
- 20-22 Ashland Ave
- 23 Chase St
- 123 Lawrence St
- 29 Center St
- 281 Broadway
- 83 Arnold St
- 7-9 Carleton Ct
- 7 Field Ave
- 23 Bentley Cir
- 20 Ruskin Ave
- 97 Kenwood Rd
- 434-438 Hampshire St
- 36 Manchester St
- 27 Willow St Unit A
- 179-181 West St
- 35 Maplewood Ave
- 29-31 Washington St
- 74-74 1/2 Union St
- 46 Union St
- 4-6 Union St
- 11 Oakland Ave
- 7 Oakland Ave
- 267(Lot 9) Oakland Ave Extension
- 8 Union St
- 13 Oakland Ave
- 2 Edmond St
- 5 Union St Unit 2
- 3 Union St
- 10 Union St Unit 12
- 15 Oakland Ave Unit 17
- 4 Edmond St
- 6 Edmond St
- 178 Broadway
- 178 Broadway Unit 2
- 176 Broadway
- 176 Broadway Unit 2
- 19 Union St
Your Personal Tour Guide
Ask me questions while you tour the home.