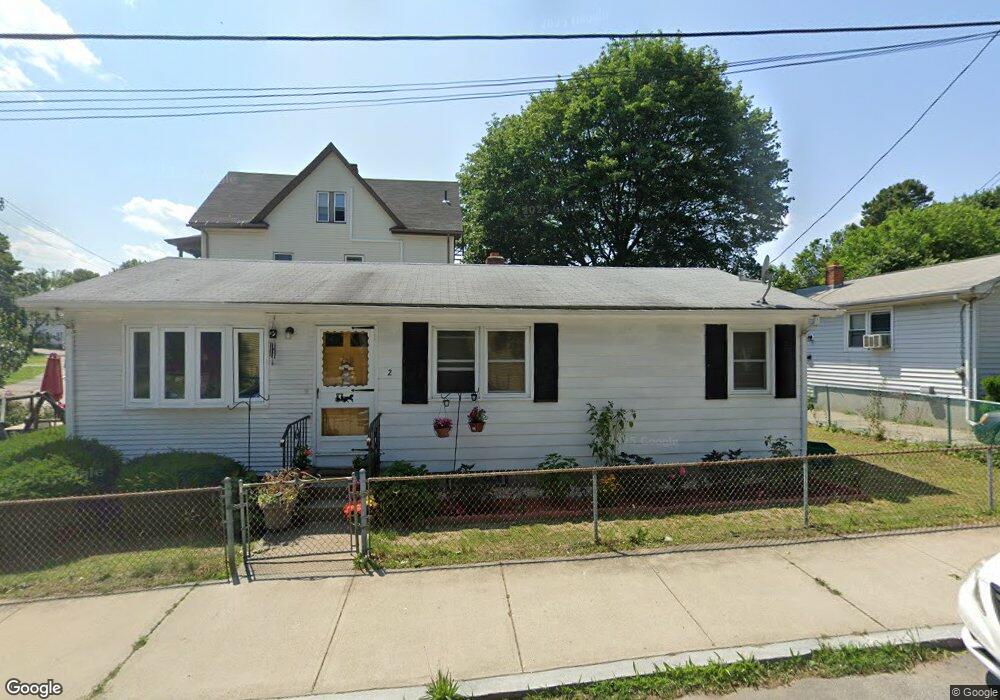
2 Vaughan St Providence, RI 02904
Charles NeighborhoodEstimated Value: $351,000 - $390,000
3
Beds
1
Bath
1,008
Sq Ft
$365/Sq Ft
Est. Value
About This Home
This home is located at 2 Vaughan St, Providence, RI 02904 and is currently estimated at $367,429, approximately $364 per square foot. 2 Vaughan St is a home located in Providence County with nearby schools including Times Squared Academy, Times2 Elementary School, and The San Miguel School.
Ownership History
Date
Name
Owned For
Owner Type
Purchase Details
Closed on
Nov 10, 2021
Sold by
Marsula Thomas
Bought by
Reynoso Virginia M
Current Estimated Value
Home Financials for this Owner
Home Financials are based on the most recent Mortgage that was taken out on this home.
Original Mortgage
$121,854
Outstanding Balance
$110,815
Interest Rate
3.05%
Mortgage Type
New Conventional
Estimated Equity
$256,614
Purchase Details
Closed on
Mar 31, 1997
Sold by
Pace Carol
Bought by
Marsula Thomas and Reynoso Virginia M
Home Financials for this Owner
Home Financials are based on the most recent Mortgage that was taken out on this home.
Original Mortgage
$50,450
Interest Rate
7.59%
Mortgage Type
Purchase Money Mortgage
Create a Home Valuation Report for This Property
The Home Valuation Report is an in-depth analysis detailing your home's value as well as a comparison with similar homes in the area
Home Values in the Area
Average Home Value in this Area
Purchase History
| Date | Buyer | Sale Price | Title Company |
|---|---|---|---|
| Reynoso Virginia M | -- | None Available | |
| Marsula Thomas | $50,000 | -- |
Source: Public Records
Mortgage History
| Date | Status | Borrower | Loan Amount |
|---|---|---|---|
| Open | Reynoso Virginia M | $121,854 | |
| Previous Owner | Marsula Thomas | $103,000 | |
| Previous Owner | Marsula Thomas | $66,000 | |
| Previous Owner | Marsula Thomas | $50,450 |
Source: Public Records
Tax History
| Year | Tax Paid | Tax Assessment Tax Assessment Total Assessment is a certain percentage of the fair market value that is determined by local assessors to be the total taxable value of land and additions on the property. | Land | Improvement |
|---|---|---|---|---|
| 2025 | $2,706 | $322,100 | $126,400 | $195,700 |
| 2024 | $4,353 | $237,200 | $67,100 | $170,100 |
| 2023 | $4,353 | $237,200 | $67,100 | $170,100 |
| 2022 | $4,222 | $237,200 | $67,100 | $170,100 |
| 2021 | $3,991 | $162,500 | $60,100 | $102,400 |
| 2020 | $3,991 | $162,500 | $60,100 | $102,400 |
| 2019 | $3,991 | $162,500 | $60,100 | $102,400 |
| 2018 | $3,781 | $118,300 | $46,500 | $71,800 |
| 2017 | $3,781 | $118,300 | $46,500 | $71,800 |
| 2016 | $3,781 | $118,300 | $46,500 | $71,800 |
| 2015 | $3,704 | $111,900 | $49,200 | $62,700 |
| 2014 | $3,699 | $109,600 | $49,200 | $60,400 |
| 2013 | $3,648 | $108,100 | $49,200 | $58,900 |
Source: Public Records
Map
Nearby Homes
- 6 Vaughan St
- 75 Northrup Ave
- 4 Vaughan St
- 75 Northup Ave
- 12 Vaughan St
- 67 Northrup Ave Unit 1
- 1 Vaughan St
- 65 Northup Ave Unit 65
- 65 Northup Ave Unit 2
- 9 Vaughan St
- 65 Northrup Ave Unit 2
- 1 Malvern St
- 3 Malvern St
- 63 Northrup Ave Unit 63
- 63 Northrup Ave Unit 3
- 59 Northrup Ave Unit 5
- 59 Northrup Ave Unit 59
- 15 Vaughan St
- 61 Northrup Ave Unit 4
- 61 Northrup Ave
Your Personal Tour Guide
Ask me questions while you tour the home.