Estimated Value: $442,000 - $517,000
About This Home
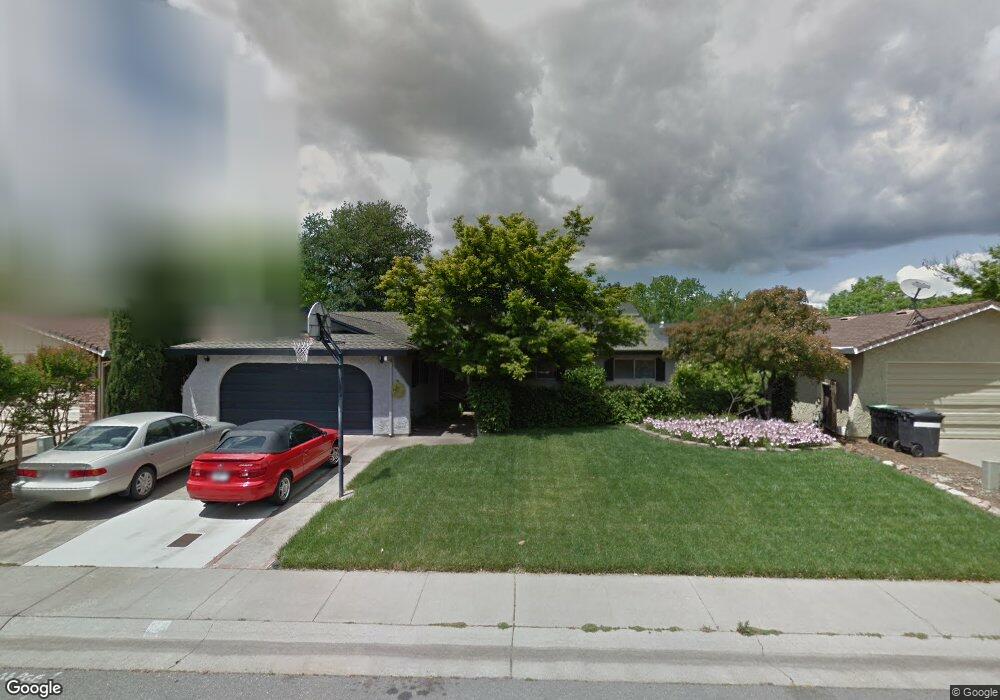
This home is located at 2 Victoria Way, Chico, CA 95926 and is currently estimated at $480,080, approximately $284 per square foot. 2 Victoria Way is a home located in Butte County with nearby schools including Sierra View Elementary School, Harry M. Marsh Junior High School, and Pleasant Valley High School.
Ownership History
We collect this data history from publicly available records. To have your information removed, we recommend requesting removal directly through your county’s website.
Purchase Details
Purchase Details
Home Financials for this Owner
Home Financials are based on the most recent Mortgage that was taken out on this home.Purchase Details
Purchase Details
Home Financials for this Owner
Home Financials are based on the most recent Mortgage that was taken out on this home.Purchase History
We collect this data history from publicly available records. To have your information removed, we recommend requesting removal directly through your county’s website.
| Date | Buyer | Sale Price | Title Company |
|---|---|---|---|
| -- | None Available | ||
| $236,000 | Mid Valley Title & Escrow Co | ||
| $30,000 | None Available | ||
| $148,000 | Fidelity National Title |
Mortgage History
We collect this data history from publicly available records. To have your information removed, we recommend requesting removal directly through your county’s website.
| Date | Status | Borrower | Loan Amount |
|---|---|---|---|
| Open | $123,000 | ||
| Previous Owner | $118,400 |
Tax History
We collect this data history from publicly available records. To have your information removed, we recommend requesting removal directly through your county’s website.
| Year | Tax Paid | Tax Assessment Tax Assessment Total Assessment is a certain percentage of the fair market value that is determined by local assessors to be the total taxable value of land and additions on the property. | Land | Improvement |
|---|---|---|---|---|
| 2025 | $3,279 | $302,023 | $153,735 | $148,288 |
| 2024 | $3,279 | $296,102 | $150,721 | $145,381 |
| 2023 | $3,240 | $290,297 | $147,766 | $142,531 |
| 2022 | $3,188 | $284,606 | $144,869 | $139,737 |
| 2021 | $3,128 | $279,027 | $142,029 | $136,998 |
| 2020 | $3,119 | $276,167 | $140,573 | $135,594 |
| 2019 | $3,063 | $270,753 | $137,817 | $132,936 |
| 2018 | $3,007 | $265,445 | $135,115 | $130,330 |
| 2017 | $2,946 | $260,241 | $132,466 | $127,775 |
| 2016 | $2,689 | $255,139 | $129,869 | $125,270 |
| 2015 | $2,689 | $251,308 | $127,919 | $123,389 |
| 2014 | $2,624 | $246,386 | $125,414 | $120,972 |
Map
- 480 Redwood Way
- 13 Joy Ln
- 2 Summerwood Ct
- 1685 Hooker Oak Ave
- 605 Acacia Ln
- 6 Creekwood Ct
- 1675 Manzanita Ave Unit 117
- 1675 Manzanita Ave Unit 93
- 1675 Manzanita Ave Unit 78
- 1675 Manzanita Ave Unit 110
- 1915 Manzanita Ave
- 45 Kirk Way
- 11 Alameda Park Cir
- 2500 Shooting Star Way Unit 64
- 994 Jenooke Ln
- 2820 Pennyroyal Dr
- 59 Saint Francis Dr
- 2932 Pennyroyal Dr
- 34 Nicole Ln
- 2865 Pennyroyal Dr
Ask me questions while you tour the home.