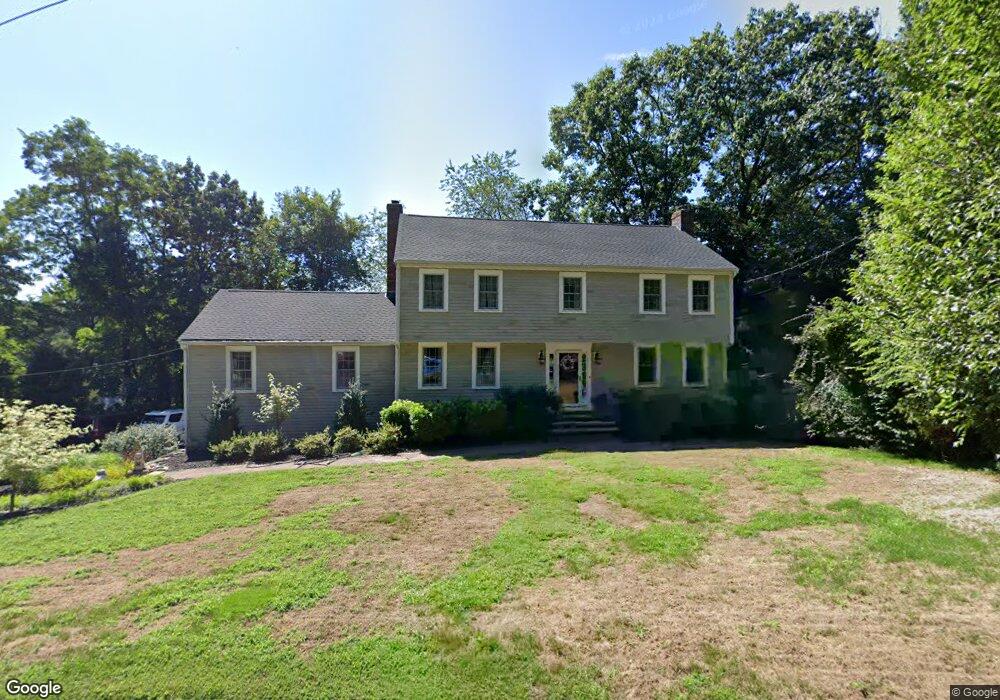
2 Vinson Cir Winchester, MA 01890
West Side NeighborhoodEstimated Value: $1,726,000 - $2,001,000
4
Beds
4
Baths
3,453
Sq Ft
$542/Sq Ft
Est. Value
About This Home
This home is located at 2 Vinson Cir, Winchester, MA 01890 and is currently estimated at $1,873,173, approximately $542 per square foot. 2 Vinson Cir is a home located in Middlesex County with nearby schools including Vinson-Owen Elementary School, McCall Middle School, and Winchester High School.
Ownership History
Date
Name
Owned For
Owner Type
Purchase Details
Closed on
Aug 1, 2002
Sold by
Fitzgerald Michael E and Fitzgerald Mary J
Bought by
Butler Gregory A and Butler Jacqueline
Current Estimated Value
Home Financials for this Owner
Home Financials are based on the most recent Mortgage that was taken out on this home.
Original Mortgage
$300,000
Outstanding Balance
$127,761
Interest Rate
6.64%
Mortgage Type
Purchase Money Mortgage
Estimated Equity
$1,745,412
Create a Home Valuation Report for This Property
The Home Valuation Report is an in-depth analysis detailing your home's value as well as a comparison with similar homes in the area
Home Values in the Area
Average Home Value in this Area
Purchase History
| Date | Buyer | Sale Price | Title Company |
|---|---|---|---|
| Butler Gregory A | $760,000 | -- |
Source: Public Records
Mortgage History
| Date | Status | Borrower | Loan Amount |
|---|---|---|---|
| Open | Butler Gregory A | $300,000 |
Source: Public Records
Tax History Compared to Growth
Tax History
| Year | Tax Paid | Tax Assessment Tax Assessment Total Assessment is a certain percentage of the fair market value that is determined by local assessors to be the total taxable value of land and additions on the property. | Land | Improvement |
|---|---|---|---|---|
| 2025 | $175 | $1,578,800 | $948,300 | $630,500 |
| 2024 | $16,511 | $1,457,300 | $872,400 | $584,900 |
| 2023 | $15,283 | $1,295,200 | $720,700 | $574,500 |
| 2022 | $15,298 | $1,222,900 | $663,800 | $559,100 |
| 2021 | $14,474 | $1,128,100 | $569,000 | $559,100 |
| 2020 | $13,977 | $1,128,100 | $569,000 | $559,100 |
| 2019 | $13,201 | $1,090,100 | $531,000 | $559,100 |
| 2018 | $12,583 | $1,032,200 | $488,400 | $543,800 |
| 2017 | $12,400 | $1,009,800 | $488,400 | $521,400 |
| 2016 | $11,612 | $994,200 | $488,400 | $505,800 |
| 2015 | $11,083 | $912,900 | $425,800 | $487,100 |
| 2014 | $11,253 | $888,900 | $407,800 | $481,100 |
Source: Public Records
Map
Nearby Homes