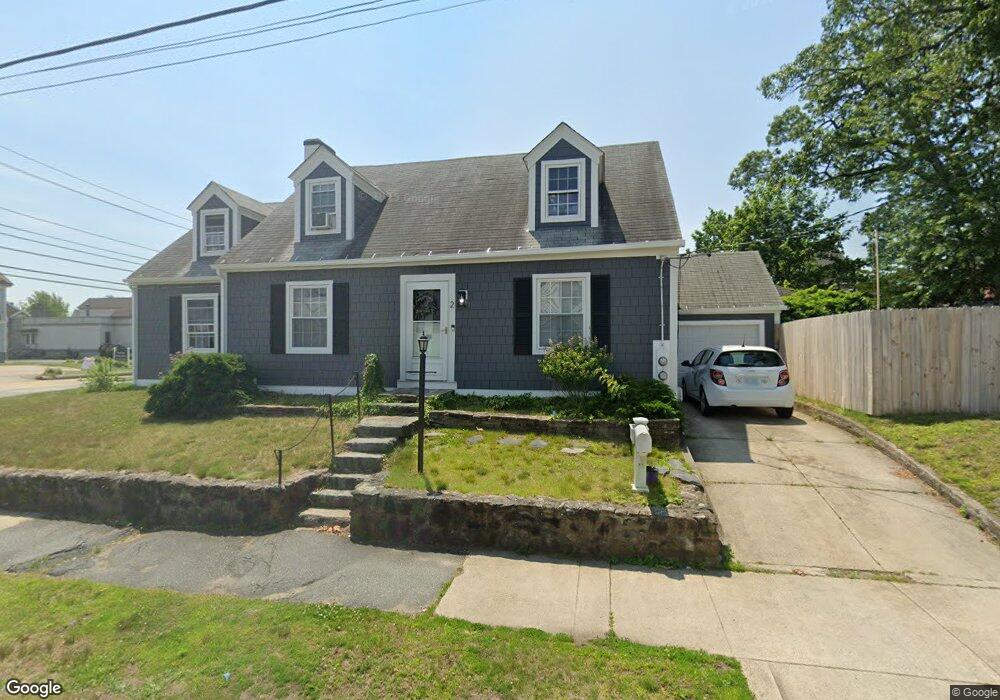
2 Waterman Ave Cranston, RI 02910
Eden Park NeighborhoodEstimated Value: $475,389 - $546,000
4
Beds
3
Baths
2,326
Sq Ft
$222/Sq Ft
Est. Value
About This Home
This home is located at 2 Waterman Ave, Cranston, RI 02910 and is currently estimated at $515,347, approximately $221 per square foot. 2 Waterman Ave is a home located in Providence County with nearby schools including Eden Park Elementary School, Park View Middle School, and Cranston High School East.
Ownership History
Date
Name
Owned For
Owner Type
Purchase Details
Closed on
Oct 8, 2015
Sold by
Donald R Rasmussen T
Bought by
Rasmussen Robert
Current Estimated Value
Home Financials for this Owner
Home Financials are based on the most recent Mortgage that was taken out on this home.
Original Mortgage
$144,000
Interest Rate
3.88%
Mortgage Type
New Conventional
Purchase Details
Closed on
Jun 7, 2011
Sold by
Rasmussen Donald R and Rasmussen Cvirginia A
Bought by
Dec Donald R Rasmussen
Purchase Details
Closed on
Feb 6, 1989
Sold by
Christofaro Steven
Bought by
Rasmussen Donald R
Home Financials for this Owner
Home Financials are based on the most recent Mortgage that was taken out on this home.
Original Mortgage
$75,000
Interest Rate
10.62%
Create a Home Valuation Report for This Property
The Home Valuation Report is an in-depth analysis detailing your home's value as well as a comparison with similar homes in the area
Home Values in the Area
Average Home Value in this Area
Purchase History
| Date | Buyer | Sale Price | Title Company |
|---|---|---|---|
| Rasmussen Robert | $180,000 | -- | |
| Dec Donald R Rasmussen | -- | -- | |
| Rasmussen Donald R | $157,000 | -- |
Source: Public Records
Mortgage History
| Date | Status | Borrower | Loan Amount |
|---|---|---|---|
| Closed | Rasmussen Donald R | $144,000 | |
| Previous Owner | Rasmussen Donald R | $90,000 | |
| Previous Owner | Rasmussen Donald R | $75,000 |
Source: Public Records
Tax History
| Year | Tax Paid | Tax Assessment Tax Assessment Total Assessment is a certain percentage of the fair market value that is determined by local assessors to be the total taxable value of land and additions on the property. | Land | Improvement |
|---|---|---|---|---|
| 2025 | $5,149 | $371,000 | $97,200 | $273,800 |
| 2024 | $5,049 | $371,000 | $97,200 | $273,800 |
| 2023 | $4,765 | $252,100 | $64,000 | $188,100 |
| 2022 | $4,666 | $252,100 | $64,000 | $188,100 |
| 2021 | $4,538 | $252,100 | $64,000 | $188,100 |
| 2020 | $4,376 | $210,700 | $60,900 | $149,800 |
| 2019 | $4,376 | $210,700 | $60,900 | $149,800 |
| 2018 | $4,275 | $210,700 | $60,900 | $149,800 |
| 2017 | $4,251 | $185,300 | $54,800 | $130,500 |
| 2016 | $4,160 | $185,300 | $54,800 | $130,500 |
| 2015 | $4,160 | $185,300 | $54,800 | $130,500 |
| 2014 | $4,045 | $177,100 | $54,800 | $122,300 |
Source: Public Records
Map
Nearby Homes
- 497 Pontiac Ave
- 483 Pontiac Ave
- 483 Pontiac Ave Unit 3
- 10 Waterman Ave
- 9 Oakland Ave
- 9 Waterman Ave
- 503 Pontiac Ave
- 16 Waterman Ave
- 481 Pontiac Ave
- 17 Waterman Ave
- 496 Pontiac Ave
- 496 Pontiac Ave Unit 1
- 20 Waterman Ave
- 480 Pontiac Ave
- 17 Oakland Ave
- 21 Waterman Ave
- 500 Pontiac Ave
- 10 Blackamore Ave
- 473 Pontiac Ave
- 131 Richard St
Your Personal Tour Guide
Ask me questions while you tour the home.