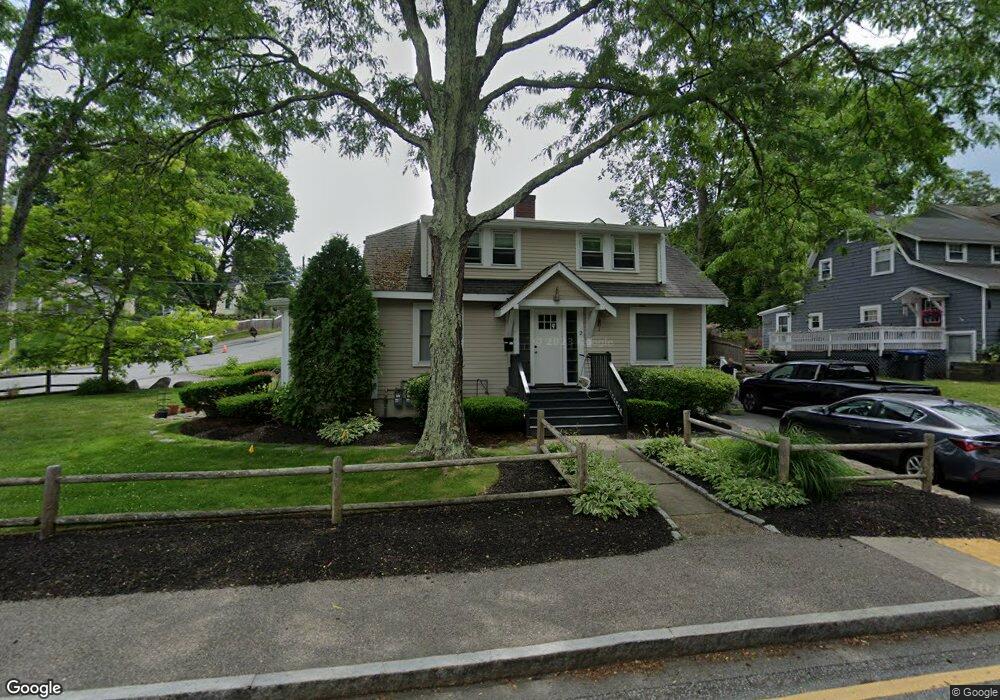
2 West St Natick, MA 01760
Estimated Value: $714,000 - $1,193,000
4
Beds
2
Baths
1,922
Sq Ft
$452/Sq Ft
Est. Value
About This Home
This home is located at 2 West St, Natick, MA 01760 and is currently estimated at $869,626, approximately $452 per square foot. 2 West St is a home located in Middlesex County with nearby schools including Natick High School, Johnson Elementary School, and J F Kennedy Middle School.
Ownership History
Date
Name
Owned For
Owner Type
Purchase Details
Closed on
Mar 12, 2025
Sold by
Lioce Michael D and Wales Lorraine R
Bought by
Lioce and Lioce Wales T
Current Estimated Value
Purchase Details
Closed on
May 28, 2021
Sold by
Natick 2 Rt and Lioce
Bought by
Lioce Michael D and Lioce Lorraine R
Home Financials for this Owner
Home Financials are based on the most recent Mortgage that was taken out on this home.
Original Mortgage
$267,000
Interest Rate
2.2%
Mortgage Type
New Conventional
Create a Home Valuation Report for This Property
The Home Valuation Report is an in-depth analysis detailing your home's value as well as a comparison with similar homes in the area
Home Values in the Area
Average Home Value in this Area
Purchase History
| Date | Buyer | Sale Price | Title Company |
|---|---|---|---|
| Lioce | -- | -- | |
| Lioce | -- | -- | |
| Lioce Michael D | -- | None Available | |
| Lioce Michael D | -- | None Available | |
| Lioce Michael D | -- | None Available |
Source: Public Records
Mortgage History
| Date | Status | Borrower | Loan Amount |
|---|---|---|---|
| Previous Owner | Lioce Michael D | $267,000 |
Source: Public Records
Tax History
| Year | Tax Paid | Tax Assessment Tax Assessment Total Assessment is a certain percentage of the fair market value that is determined by local assessors to be the total taxable value of land and additions on the property. | Land | Improvement |
|---|---|---|---|---|
| 2025 | $7,967 | $666,100 | $387,800 | $278,300 |
| 2024 | $7,650 | $624,000 | $365,000 | $259,000 |
| 2023 | $7,198 | $569,500 | $351,300 | $218,200 |
| 2022 | $6,922 | $518,900 | $319,400 | $199,500 |
| 2021 | $6,621 | $486,500 | $301,100 | $185,400 |
| 2020 | $6,315 | $464,000 | $287,400 | $176,600 |
| 2019 | $5,897 | $464,000 | $287,400 | $176,600 |
| 2018 | $5,820 | $446,000 | $273,700 | $172,300 |
| 2017 | $5,422 | $401,900 | $232,700 | $169,200 |
| 2016 | $5,060 | $372,900 | $205,300 | $167,600 |
| 2015 | $4,937 | $357,200 | $205,300 | $151,900 |
Source: Public Records
Map
Nearby Homes
- 16 West St
- 25 Forest Ave
- 62 Oakland St
- 6 Floral Avenue Extension
- 216-218 S Main St
- 89 W Central St
- 8 Floral Avenue Extension
- 63 Pond St
- 58 W Central St
- 12 Floral Ave
- 14 Pinewood Ave
- 8 Floral Ave Unit 8
- 49 Summer St
- 9 Bellevue Rd
- 1 Fern St
- 7 Allison Way Unit 7
- 11 Avon St
- 6A Lincoln St Unit 6A
- 4B Lincoln St Unit 4B
- 5 Wilson St Unit 5A
Your Personal Tour Guide
Ask me questions while you tour the home.