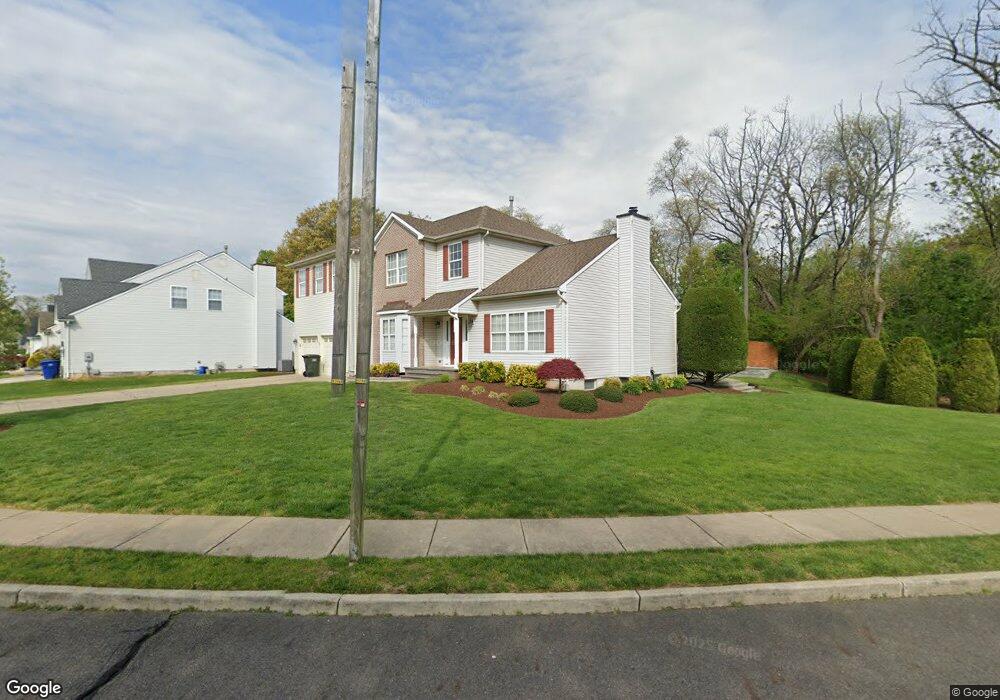
2 Whitby Ct Lumberton, NJ 08048
Estimated Value: $605,954 - $686,000
--
Bed
--
Bath
2,717
Sq Ft
$237/Sq Ft
Est. Value
About This Home
This home is located at 2 Whitby Ct, Lumberton, NJ 08048 and is currently estimated at $644,239, approximately $237 per square foot. 2 Whitby Ct is a home located in Burlington County with nearby schools including Ashbrook Elementary School, Bobby’s Run School, and Lumberton Middle School.
Ownership History
Date
Name
Owned For
Owner Type
Purchase Details
Closed on
Jan 17, 2017
Sold by
Iacoponi Mary
Bought by
Iacoponi Louis
Current Estimated Value
Home Financials for this Owner
Home Financials are based on the most recent Mortgage that was taken out on this home.
Original Mortgage
$284,000
Outstanding Balance
$234,242
Interest Rate
4.15%
Mortgage Type
New Conventional
Estimated Equity
$409,997
Purchase Details
Closed on
Dec 22, 1995
Sold by
Signature Homes Inc
Bought by
Iacoponi Louis and Iacoponi Mary
Home Financials for this Owner
Home Financials are based on the most recent Mortgage that was taken out on this home.
Original Mortgage
$157,350
Interest Rate
7.34%
Purchase Details
Closed on
Jul 7, 1995
Sold by
Silverstein Raymond
Bought by
Signature Homes Inc
Create a Home Valuation Report for This Property
The Home Valuation Report is an in-depth analysis detailing your home's value as well as a comparison with similar homes in the area
Home Values in the Area
Average Home Value in this Area
Purchase History
| Date | Buyer | Sale Price | Title Company |
|---|---|---|---|
| Iacoponi Louis | -- | Title Source Inc | |
| Iacoponi Louis | $196,700 | Fidelity Title Abstract Co | |
| Signature Homes Inc | $94,000 | Fidelity Title Abstract Co |
Source: Public Records
Mortgage History
| Date | Status | Borrower | Loan Amount |
|---|---|---|---|
| Open | Iacoponi Louis | $284,000 | |
| Closed | Iacoponi Louis | $157,350 |
Source: Public Records
Tax History Compared to Growth
Tax History
| Year | Tax Paid | Tax Assessment Tax Assessment Total Assessment is a certain percentage of the fair market value that is determined by local assessors to be the total taxable value of land and additions on the property. | Land | Improvement |
|---|---|---|---|---|
| 2025 | $10,158 | $381,600 | $91,700 | $289,900 |
| 2024 | $9,551 | $381,600 | $91,700 | $289,900 |
| 2023 | $9,551 | $381,600 | $91,700 | $289,900 |
| 2022 | $9,330 | $381,600 | $91,700 | $289,900 |
| 2021 | $9,303 | $381,600 | $91,700 | $289,900 |
| 2020 | $9,223 | $381,600 | $91,700 | $289,900 |
| 2019 | $9,120 | $381,600 | $91,700 | $289,900 |
| 2018 | $8,983 | $381,600 | $91,700 | $289,900 |
| 2017 | $8,815 | $381,600 | $91,700 | $289,900 |
| 2016 | $8,624 | $381,600 | $91,700 | $289,900 |
| 2015 | $8,559 | $381,600 | $91,700 | $289,900 |
| 2014 | $8,235 | $381,600 | $91,700 | $289,900 |
Source: Public Records
Map
Nearby Homes
- 15 Wellington Dr
- 10 Whitehaven Dr
- 5 Middleton Dr
- 587 Main St
- 26 Chestnut St
- 71 Kingsbridge Dr
- 8 Banbury Rd
- 18 Westminster Dr
- 44 Rockland Terrace
- 485 Main St
- 5 Beulah Ave
- 511 Hamilton Ave
- 8 Hollybrook Ave
- 23 Creek Rd
- 8 Easlick Ave
- 11 Abington Way
- 225 Ashley Ln
- 39 Tynemouth Dr
- 50 Blue Spruce Ct
- 21 Mulberry Ct