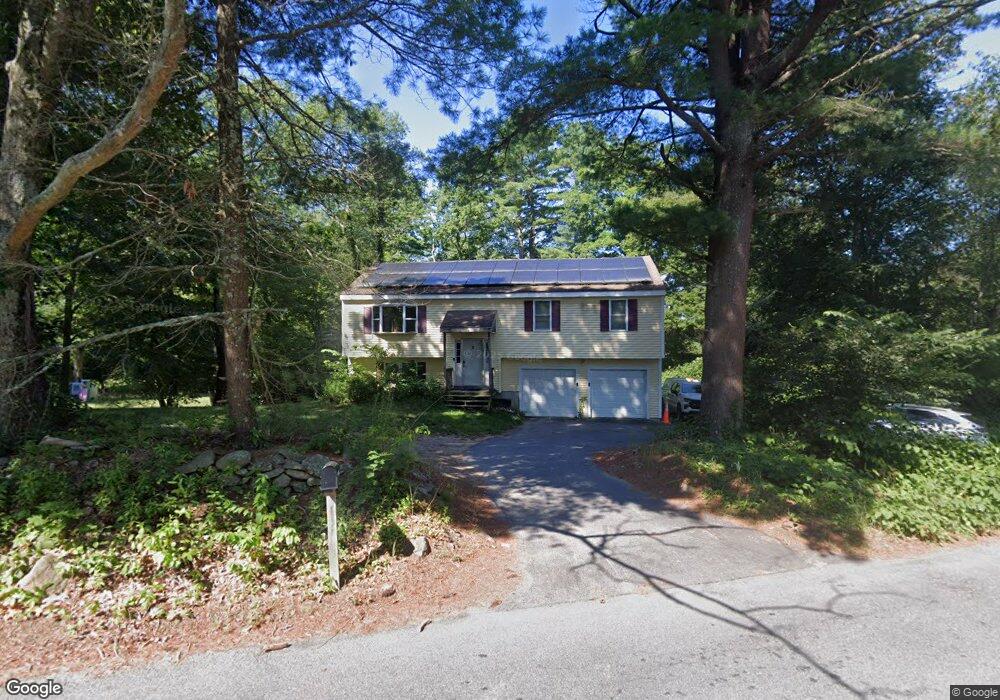
2 Wilmarth Bridge Rd Rehoboth, MA 02769
Estimated Value: $492,971 - $647,000
3
Beds
3
Baths
1,196
Sq Ft
$473/Sq Ft
Est. Value
About This Home
This home is located at 2 Wilmarth Bridge Rd, Rehoboth, MA 02769 and is currently estimated at $565,493, approximately $472 per square foot. 2 Wilmarth Bridge Rd is a home located in Bristol County with nearby schools including Dighton-Rehoboth Regional High School, Cedar Brook School, and St Margaret School.
Ownership History
Date
Name
Owned For
Owner Type
Purchase Details
Closed on
Jan 2, 2009
Sold by
Shadco Dev Llc
Bought by
Hardmon Richard and Hardmon Tamecka
Current Estimated Value
Home Financials for this Owner
Home Financials are based on the most recent Mortgage that was taken out on this home.
Original Mortgage
$302,902
Outstanding Balance
$200,468
Interest Rate
6.08%
Mortgage Type
Purchase Money Mortgage
Estimated Equity
$365,025
Purchase Details
Closed on
Jul 18, 2008
Sold by
Ovoian Robert S
Bought by
Shadco Dev Llc
Home Financials for this Owner
Home Financials are based on the most recent Mortgage that was taken out on this home.
Original Mortgage
$55,000
Interest Rate
6.17%
Mortgage Type
Purchase Money Mortgage
Create a Home Valuation Report for This Property
The Home Valuation Report is an in-depth analysis detailing your home's value as well as a comparison with similar homes in the area
Home Values in the Area
Average Home Value in this Area
Purchase History
| Date | Buyer | Sale Price | Title Company |
|---|---|---|---|
| Hardmon Richard | $306,900 | -- | |
| Shadco Dev Llc | $110,000 | -- |
Source: Public Records
Mortgage History
| Date | Status | Borrower | Loan Amount |
|---|---|---|---|
| Open | Hardmon Richard | $302,902 | |
| Previous Owner | Shadco Dev Llc | $55,000 |
Source: Public Records
Tax History
| Year | Tax Paid | Tax Assessment Tax Assessment Total Assessment is a certain percentage of the fair market value that is determined by local assessors to be the total taxable value of land and additions on the property. | Land | Improvement |
|---|---|---|---|---|
| 2025 | $43 | $388,900 | $154,400 | $234,500 |
| 2024 | $4,556 | $401,100 | $154,400 | $246,700 |
| 2023 | $4,297 | $371,100 | $151,500 | $219,600 |
| 2022 | $4,054 | $320,000 | $144,600 | $175,400 |
| 2021 | $2,825 | $303,500 | $131,000 | $172,500 |
| 2020 | $3,683 | $280,700 | $131,000 | $149,700 |
| 2018 | $4,360 | $267,100 | $124,900 | $142,200 |
| 2017 | $3,151 | $250,900 | $124,900 | $126,000 |
| 2016 | $3,092 | $254,500 | $124,900 | $129,600 |
| 2015 | $2,996 | $243,400 | $118,900 | $124,500 |
| 2014 | $2,797 | $224,800 | $113,300 | $111,500 |
Source: Public Records
Map
Nearby Homes
- 23 Colonial Way
- 252 Pine St
- 7 Ciana Rd
- 6 Running Stream Rd
- 9 Wedge Way
- 67 Wheeler St
- 111 Summer St
- 20 School St
- 0 Winter St
- 321 Winthrop St
- 24 Danforth St
- 145 Winthrop St
- 794 County St
- 139 Rocky Hill Rd
- 44 Hope St
- 1 Clubhouse Way
- 156 Rocky Hill Rd
- 267 Chestnut St
- 7 Ledge Hill Ln
- 209 Providence St Bldr Lot 1
Your Personal Tour Guide
Ask me questions while you tour the home.