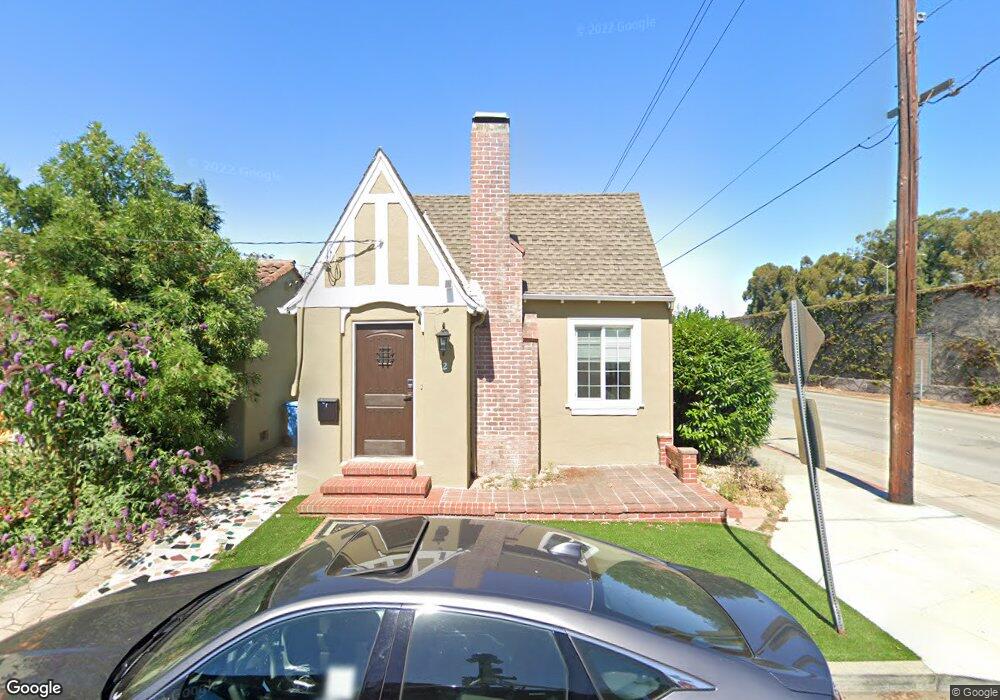
2 Winchester Place Burlingame, CA 94010
Burlingame Gardens NeighborhoodEstimated Value: $1,815,000 - $2,777,000
3
Beds
2
Baths
1,700
Sq Ft
$1,249/Sq Ft
Est. Value
About This Home
This home is located at 2 Winchester Place, Burlingame, CA 94010 and is currently estimated at $2,123,043, approximately $1,248 per square foot. 2 Winchester Place is a home located in San Mateo County with nearby schools including McKinley Elementary School, Burlingame Intermediate School, and Burlingame High School.
Ownership History
Date
Name
Owned For
Owner Type
Purchase Details
Closed on
Dec 22, 2015
Sold by
Leung David H and Jiang Barbara
Bought by
Leung David H and Revoc Barbara Jiang 2015
Current Estimated Value
Purchase Details
Closed on
May 15, 2013
Sold by
Chang Amy Hui Chen
Bought by
Leung David and Jiang Barbara
Purchase Details
Closed on
Jul 6, 2010
Sold by
Crawford Zelte and Crawford Cubie D
Bought by
Chang Amy Hui Chen
Purchase Details
Closed on
Jun 22, 2010
Sold by
Tan Tian Hong
Bought by
Chang Amy Hui Chen
Purchase Details
Closed on
Dec 1, 1997
Sold by
Gutierrez Virginia A and Gutierrez Virginia W
Bought by
Crawford Zelte and Crawford Cubie D
Home Financials for this Owner
Home Financials are based on the most recent Mortgage that was taken out on this home.
Original Mortgage
$173,600
Interest Rate
7.16%
Create a Home Valuation Report for This Property
The Home Valuation Report is an in-depth analysis detailing your home's value as well as a comparison with similar homes in the area
Home Values in the Area
Average Home Value in this Area
Purchase History
| Date | Buyer | Sale Price | Title Company |
|---|---|---|---|
| Leung David H | -- | None Available | |
| Leung David | $870,000 | Fidelity National Title Co | |
| Chang Amy Hui Chen | $500,000 | First American Title Company | |
| Chang Amy Hui Chen | -- | First American Title Company | |
| Crawford Zelte | $217,000 | Old Republic Title Ins Compa |
Source: Public Records
Mortgage History
| Date | Status | Borrower | Loan Amount |
|---|---|---|---|
| Previous Owner | Crawford Zelte | $173,600 |
Source: Public Records
Tax History Compared to Growth
Tax History
| Year | Tax Paid | Tax Assessment Tax Assessment Total Assessment is a certain percentage of the fair market value that is determined by local assessors to be the total taxable value of land and additions on the property. | Land | Improvement |
|---|---|---|---|---|
| 2025 | $12,100 | $1,071,330 | $535,665 | $535,665 |
| 2023 | $12,100 | $1,029,730 | $514,865 | $514,865 |
| 2022 | $11,673 | $1,009,540 | $504,770 | $504,770 |
| 2021 | $11,691 | $989,746 | $494,873 | $494,873 |
| 2020 | $11,451 | $979,598 | $489,799 | $489,799 |
| 2019 | $11,199 | $960,392 | $480,196 | $480,196 |
| 2018 | $10,988 | $941,562 | $470,781 | $470,781 |
| 2017 | $10,909 | $923,100 | $461,550 | $461,550 |
| 2016 | $10,508 | $905,000 | $452,500 | $452,500 |
| 2015 | $10,462 | $891,408 | $445,704 | $445,704 |
| 2014 | $10,312 | $873,948 | $436,974 | $436,974 |
Source: Public Records
Map
Nearby Homes
- 777 Morrell Ave Unit 302
- 737 Linden Ave
- 1030 Morrell Ave
- 733 Lexington Way
- 900 Toyon Dr
- 1121 Douglas Ave Unit 201
- 481 Rollins Rd
- 1133 Douglas Ave Unit 3
- 1427 Floribunda Ave Unit 304
- 1433 Floribunda Ave Unit 5
- 1433 Floribunda Ave Unit 7
- 1433 Floribunda Ave Unit 2
- 1433 Floribunda Ave Unit 1
- 732 Paloma Ave
- 700 Howard Ave
- 1515 Floribunda Ave Unit 309
- 550 El Camino Real Unit 302
- 733 Fairfield Rd Unit 8
- 735 El Camino Real Unit 104
- 824 El Camino Real
- 6 Winchester Place
- 1 Winchester Place
- 3 Winchester Place
- 5 Winchester Place
- 8 Winchester Place
- 7 Winchester Place
- 761 Rollins Rd Unit 4
- 761 Rollins Rd Unit 3
- 761 Rollins Rd Unit 2
- 761 Rollins Rd
- 761 Rollins Rd Unit 1
- 9 Winchester Place
- 804 Winchester Dr
- 800 Winchester Dr
- 721 Rollins Rd
- 808 Winchester Dr
- 758 Winchester Dr
- 10 Winchester Place
- 510 Corbitt Dr
- 754 Winchester Dr