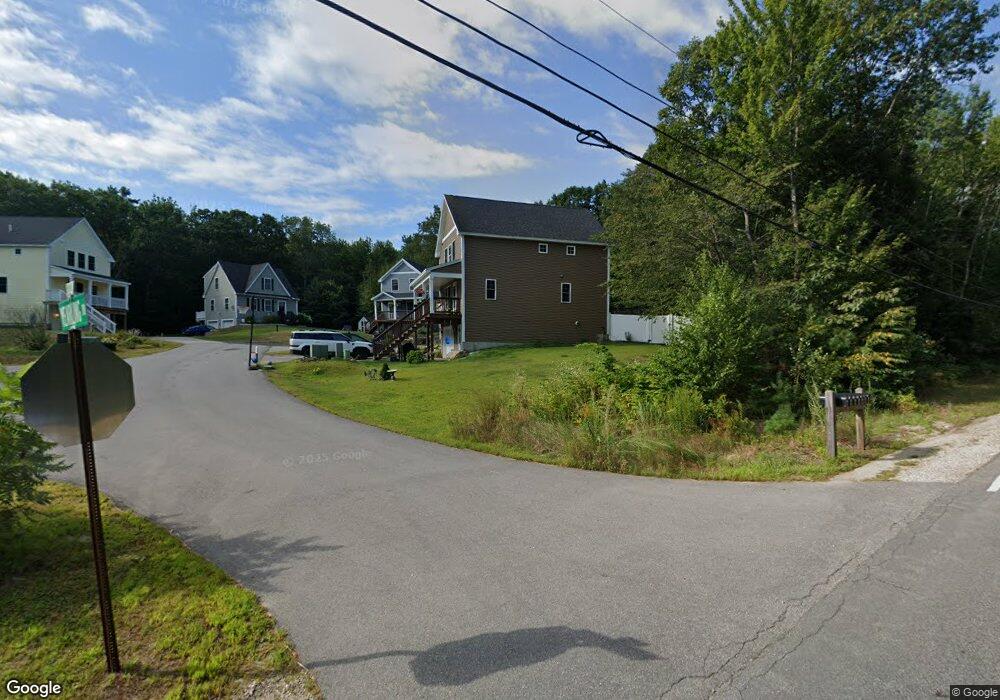
2 Yearling Dr Unit 1 Barrington, NH 03825
Estimated Value: $419,000 - $513,788
3
Beds
3
Baths
1,727
Sq Ft
$272/Sq Ft
Est. Value
About This Home
This home is located at 2 Yearling Dr Unit 1, Barrington, NH 03825 and is currently estimated at $470,447, approximately $272 per square foot. 2 Yearling Dr Unit 1 is a home located in Strafford County with nearby schools including Barrington Elementary School and Barrington Middle School.
Ownership History
Date
Name
Owned For
Owner Type
Purchase Details
Closed on
May 24, 2021
Sold by
Goldfisher Eric C and Goldfisher Jessica M
Bought by
Balfoort Kristina and Balfoort Raymond Danielle
Current Estimated Value
Home Financials for this Owner
Home Financials are based on the most recent Mortgage that was taken out on this home.
Original Mortgage
$344,350
Outstanding Balance
$312,067
Interest Rate
3.1%
Mortgage Type
Purchase Money Mortgage
Estimated Equity
$158,380
Purchase Details
Closed on
Jun 13, 2016
Sold by
Langdon Construction L
Bought by
Goldfisher Eric C and Lemp Jessica M
Home Financials for this Owner
Home Financials are based on the most recent Mortgage that was taken out on this home.
Original Mortgage
$240,562
Interest Rate
3.87%
Mortgage Type
FHA
Purchase Details
Closed on
Jun 22, 2015
Sold by
County Line Holdings L
Bought by
Langdon Construction L
Create a Home Valuation Report for This Property
The Home Valuation Report is an in-depth analysis detailing your home's value as well as a comparison with similar homes in the area
Home Values in the Area
Average Home Value in this Area
Purchase History
| Date | Buyer | Sale Price | Title Company |
|---|---|---|---|
| Balfoort Kristina | $355,000 | None Available | |
| Goldfisher Eric C | $245,000 | -- | |
| Langdon Construction L | $80,000 | -- |
Source: Public Records
Mortgage History
| Date | Status | Borrower | Loan Amount |
|---|---|---|---|
| Open | Balfoort Kristina | $344,350 | |
| Previous Owner | Goldfisher Eric C | $240,562 |
Source: Public Records
Tax History Compared to Growth
Tax History
| Year | Tax Paid | Tax Assessment Tax Assessment Total Assessment is a certain percentage of the fair market value that is determined by local assessors to be the total taxable value of land and additions on the property. | Land | Improvement |
|---|---|---|---|---|
| 2024 | $7,358 | $418,300 | $0 | $418,300 |
| 2023 | $6,981 | $418,300 | $0 | $418,300 |
| 2022 | $6,838 | $344,500 | $0 | $344,500 |
| 2021 | $6,718 | $344,500 | $0 | $344,500 |
| 2020 | $6,166 | $270,800 | $0 | $270,800 |
| 2019 | $6,139 | $270,800 | $0 | $270,800 |
| 2018 | $5,851 | $236,100 | $0 | $236,100 |
| 2017 | $5,685 | $236,100 | $0 | $236,100 |
| 2016 | $3,716 | $142,700 | $0 | $142,700 |
| 2015 | $1,513 | $60,000 | $0 | $60,000 |
| 2014 | $1,442 | $60,000 | $0 | $60,000 |
| 2013 | $8 | $357 | $357 | $0 |
Source: Public Records
Map
Nearby Homes
- 249 Cooper Hill Rd
- 2184 Franklin Pierce Hwy
- Lot 3 the Woodlands at Merry Hill
- Lot 1 the Woodlands at Merry Hill
- 31 Green St
- 62 Freeman Hall Rd
- 5 Liberty Ln
- 28-1 Range Rd
- 295 1st New Hampshire Turnpike
- 35 Merry Hill Rd
- 27 Revolutionary Ln
- Lot 70 Homestead Ln
- Lot 77 Homestead Ln
- 85 Priest Rd
- 108 Lucas Pond Rd
- 278 Stage Rd
- 18 Sofia Way
- 6 Davis Ln
- 11 Drake Hill Rd
- Map 3 Lot 18-2b and 18-2c Water St
- 2 Yearling Dr
- 2008 Franklin Pierce Hwy
- 6 Yearling Dr
- 7 Yearling Dr
- Lot 17.1 Route 202 9
- 2006 Franklin Pierce Hwy
- 17.2 Route 202 9
- 4 Conway Ln
- 13 Colcord Rd
- 19 Colcord Rd
- 6 Conway Ln
- 8 Colcord Way
- 8 Colcord Rd
- 42 Colcord Rd
- 0 Franklin Pierce Hwy
- 0 Franklin Pierce Hwy
- 0 Franklin Pierce Hwy Unit 4947530
- 0 Franklin Pierce Hwy Unit 4126411
- 0 Franklin Pierce Hwy Unit 4027454
- 0 Franklin Pierce Hwy Unit 4815662