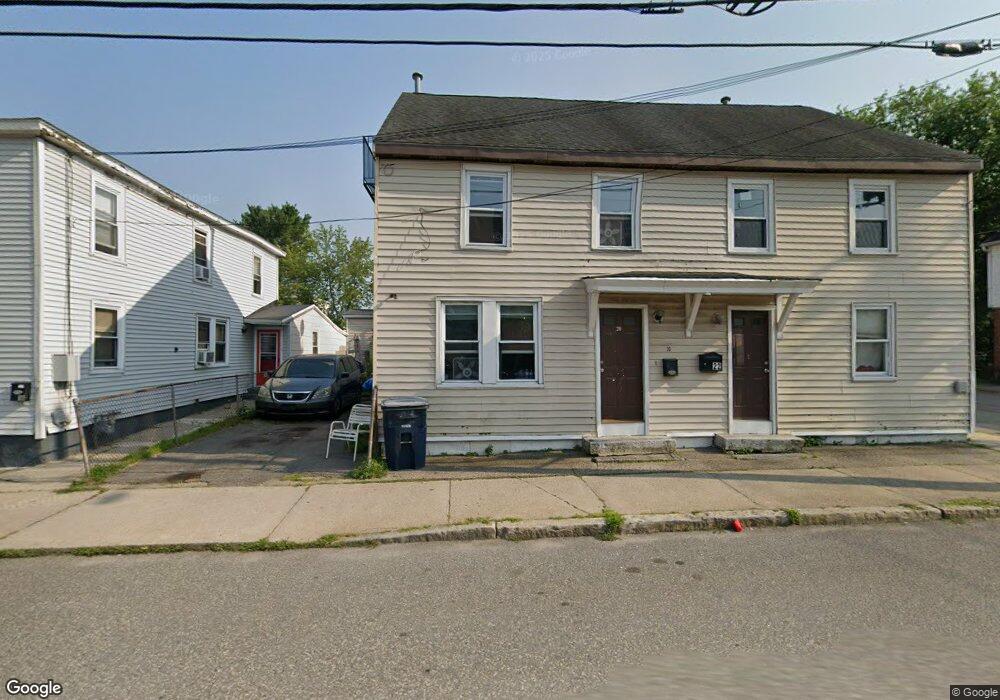
20-22 Central St Nashua, NH 03060
Mine Falls Park NeighborhoodEstimated Value: $520,305 - $625,000
7
Beds
2
Baths
2,875
Sq Ft
$197/Sq Ft
Est. Value
About This Home
This home is located at 20-22 Central St, Nashua, NH 03060 and is currently estimated at $565,076, approximately $196 per square foot. 20-22 Central St is a home located in Hillsborough County with nearby schools including Ledge Street Elementary School, Elm Street Middle School, and Nashua High School South.
Ownership History
Date
Name
Owned For
Owner Type
Purchase Details
Closed on
Sep 22, 2014
Sold by
Nhfa
Bought by
Poulose Jacob
Current Estimated Value
Purchase Details
Closed on
Jul 1, 2014
Sold by
Patrick Randall N and Patrick Nhfa
Bought by
Nhfa
Purchase Details
Closed on
Mar 3, 2008
Sold by
Gmac Mortgage Llc
Bought by
Patrick Randall N
Home Financials for this Owner
Home Financials are based on the most recent Mortgage that was taken out on this home.
Original Mortgage
$153,658
Interest Rate
5.8%
Mortgage Type
Purchase Money Mortgage
Purchase Details
Closed on
Dec 4, 2007
Sold by
Pena Juan and Gmac Mortgage Llc
Bought by
Gmac Mortgage Llc
Purchase Details
Closed on
Dec 23, 2002
Sold by
Concepcion Simon
Bought by
Pena Juan
Purchase Details
Closed on
Jun 2, 2000
Sold by
Hellenic Rt
Bought by
Concepcion Simon
Create a Home Valuation Report for This Property
The Home Valuation Report is an in-depth analysis detailing your home's value as well as a comparison with similar homes in the area
Home Values in the Area
Average Home Value in this Area
Purchase History
| Date | Buyer | Sale Price | Title Company |
|---|---|---|---|
| Poulose Jacob | $125,000 | -- | |
| Nhfa | $127,800 | -- | |
| Nhfa | $127,800 | -- | |
| Patrick Randall N | $135,000 | -- | |
| Patrick Randall N | $135,000 | -- | |
| Gmac Mortgage Llc | $230,000 | -- | |
| Gmac Mortgage Llc | $230,000 | -- | |
| Pena Juan | $179,000 | -- | |
| Pena Juan | $179,000 | -- | |
| Concepcion Simon | $85,000 | -- | |
| Concepcion Simon | $85,000 | -- |
Source: Public Records
Mortgage History
| Date | Status | Borrower | Loan Amount |
|---|---|---|---|
| Previous Owner | Concepcion Simon | $153,658 |
Source: Public Records
Tax History Compared to Growth
Tax History
| Year | Tax Paid | Tax Assessment Tax Assessment Total Assessment is a certain percentage of the fair market value that is determined by local assessors to be the total taxable value of land and additions on the property. | Land | Improvement |
|---|---|---|---|---|
| 2024 | $7,583 | $476,900 | $108,000 | $368,900 |
| 2023 | $7,039 | $386,100 | $86,400 | $299,700 |
| 2022 | $6,977 | $386,100 | $86,400 | $299,700 |
| 2021 | $5,812 | $250,300 | $54,700 | $195,600 |
| 2020 | $5,659 | $250,300 | $54,700 | $195,600 |
| 2019 | $5,447 | $250,300 | $54,700 | $195,600 |
| 2018 | $5,309 | $250,300 | $54,700 | $195,600 |
| 2017 | $4,114 | $159,500 | $50,600 | $108,900 |
| 2016 | $3,999 | $159,500 | $50,600 | $108,900 |
| 2015 | $3,913 | $159,500 | $50,600 | $108,900 |
| 2014 | -- | $159,500 | $50,600 | $108,900 |
Source: Public Records
Map
Nearby Homes
- 38 Central St
- 30 Ledge St
- 8 Buck St Unit 10
- 5 Mulberry St
- 22 Wilder St
- 4 Badger St
- 29 Wilder St
- 52 Main St Unit 402
- 121 Palm St
- 32-34 Grand Ave
- 24 E Otterson St
- 169A W Hollis St Unit 193
- 18 Harbor Ave Unit 208
- 7 Bitirnas St Unit U7
- 15 Lovell St Unit 20
- 15 Lovell St Unit 3
- 15 Lovell St Unit 7
- 15 Lovell St Unit 10
- 0 Baldwin St
- 6 Lake Ave
- 20 Central St Unit 22
- 28 Vine St
- 30 1/2 Vine St
- 30 Vine St
- 30 Vine St
- 27 Vine St Unit 29
- 29 Vine St
- 25 Vine St
- 27-29 Vine St
- 29 Chestnut St
- 31 Chestnut St
- 32 Vine St Unit 34
- 32-34 Vine St
- 31 Vine St
- 28-30 Central St
- 28 Ash St
- 28 Ash St Unit 28A
- 28 Central St Unit 30
- 41 Chestnut St Unit 43
- 41B Chestnut St