Estimated Value: $334,000 - $402,000
3
Beds
2
Baths
1,110
Sq Ft
$324/Sq Ft
Est. Value
About This Home
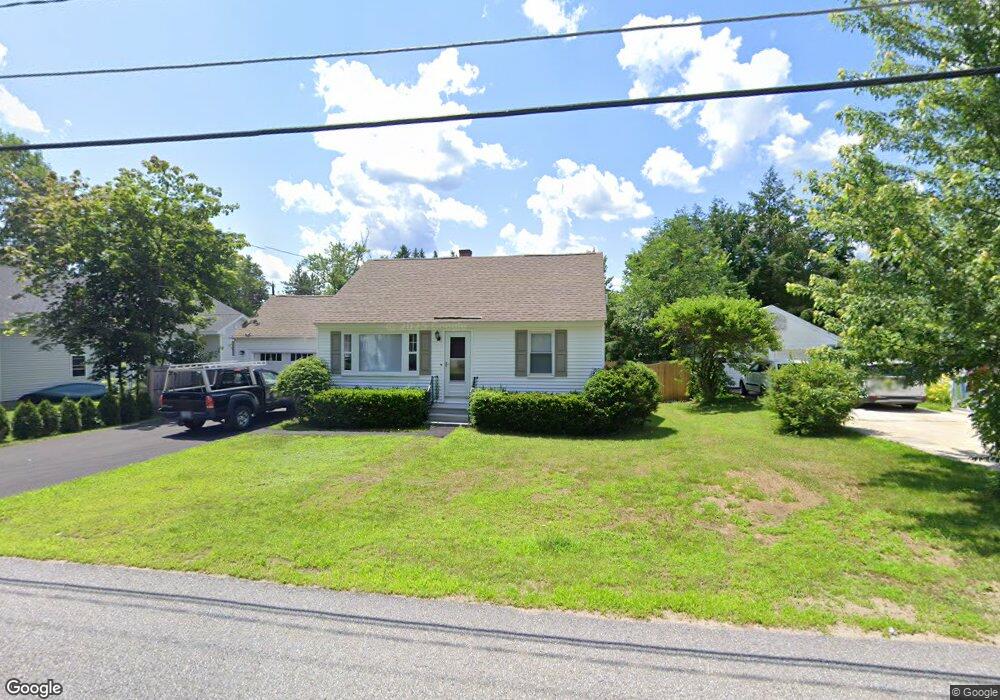
This home is located at 20 Allen Ct, Keene, NH 03431 and is currently estimated at $359,417, approximately $323 per square foot. 20 Allen Ct is a home located in Cheshire County with nearby schools including Greenlee Primary School, Keene Middle School, and Mayland Early College High School.
Ownership History
Date
Name
Owned For
Owner Type
Purchase Details
Closed on
Aug 6, 2025
Sold by
Feyling Betsy J
Bought by
Betsy J Feyling Ret and Feyling
Current Estimated Value
Purchase Details
Closed on
Aug 31, 2022
Sold by
Malo Desiree M
Bought by
Feyling Betsy
Purchase Details
Closed on
Feb 28, 2005
Sold by
Bowden James P
Bought by
Malo Desiree M and Malo Margaret G
Home Financials for this Owner
Home Financials are based on the most recent Mortgage that was taken out on this home.
Original Mortgage
$85,300
Interest Rate
5.73%
Mortgage Type
Purchase Money Mortgage
Create a Home Valuation Report for This Property
The Home Valuation Report is an in-depth analysis detailing your home's value as well as a comparison with similar homes in the area
Home Values in the Area
Average Home Value in this Area
Purchase History
| Date | Buyer | Sale Price | Title Company |
|---|---|---|---|
| Betsy J Feyling Ret | -- | -- | |
| Betsy J Feyling Ret | -- | -- | |
| Feyling Betsy | $287,533 | None Available | |
| Feyling Betsy | $287,533 | None Available | |
| Malo Desiree M | $166,500 | -- |
Source: Public Records
Mortgage History
| Date | Status | Borrower | Loan Amount |
|---|---|---|---|
| Previous Owner | Malo Desiree M | $85,300 |
Source: Public Records
Tax History Compared to Growth
Tax History
| Year | Tax Paid | Tax Assessment Tax Assessment Total Assessment is a certain percentage of the fair market value that is determined by local assessors to be the total taxable value of land and additions on the property. | Land | Improvement |
|---|---|---|---|---|
| 2024 | $6,459 | $195,300 | $46,300 | $149,000 |
| 2023 | $6,228 | $195,300 | $46,300 | $149,000 |
| 2022 | $6,060 | $195,300 | $46,300 | $149,000 |
| 2021 | $6,109 | $195,300 | $46,300 | $149,000 |
| 2020 | $5,387 | $144,500 | $49,400 | $95,100 |
| 2019 | $5,433 | $144,500 | $49,400 | $95,100 |
| 2018 | $5,364 | $144,500 | $49,400 | $95,100 |
| 2017 | $5,397 | $145,000 | $49,900 | $95,100 |
| 2016 | $5,277 | $145,000 | $49,900 | $95,100 |
| 2015 | $5,420 | $157,500 | $66,700 | $90,800 |
Source: Public Records
Map
Nearby Homes
- 39 Windsor Ct Unit B
- 67 Woodburn St
- 17 Blue Jay Ct
- 50 Forest St
- 11 Nut Hatch Ln
- 792 Court St Unit A
- 798 Court St Unit G
- 17 Meetinghouse Rd
- 7 Newman St
- 49-51 Howard St
- 257 Park Ave
- 91 Sullivan St
- 45 Blossom St
- 106 Pako Ave
- 8 Tanner Rd
- 13 Brook St
- 77 Franklin St
- 18 Stanton Ct
- 64 Old Walpole Rd
- 37 Church St Unit 3