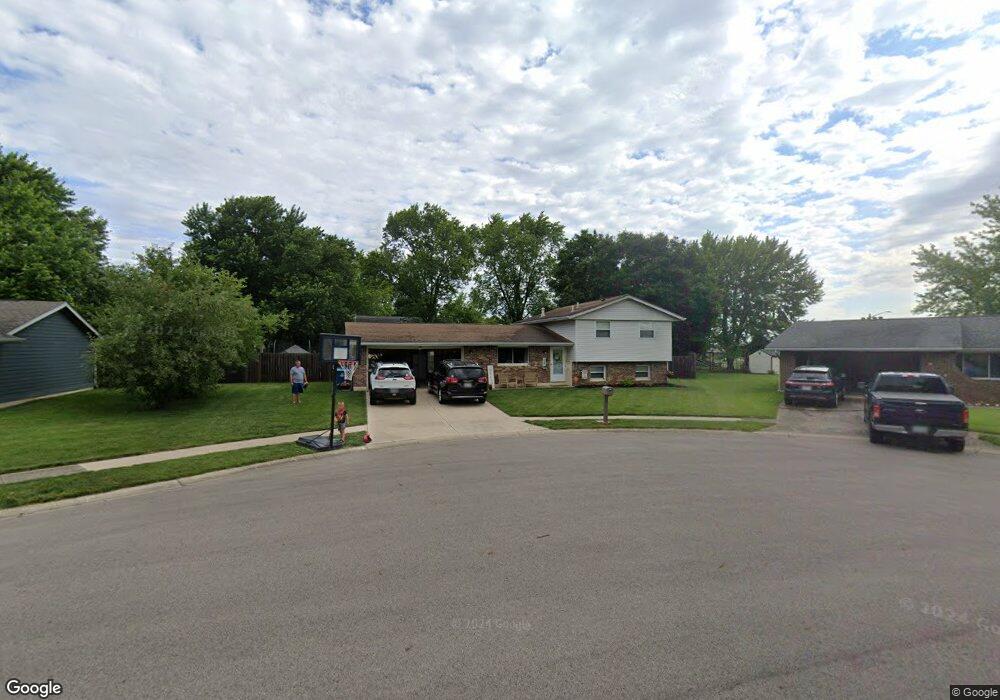
20 Apache Ct Tipp City, OH 45371
Estimated Value: $253,000 - $282,000
3
Beds
2
Baths
1,545
Sq Ft
$176/Sq Ft
Est. Value
About This Home
This home is located at 20 Apache Ct, Tipp City, OH 45371 and is currently estimated at $271,458, approximately $175 per square foot. 20 Apache Ct is a home located in Miami County with nearby schools including L. T. Ball Intermediate School, Nevin Coppock Elementary School, and Broadway Elementary School.
Ownership History
Date
Name
Owned For
Owner Type
Purchase Details
Closed on
Mar 9, 2018
Sold by
Davis Alexander M and Davis Alyssa A
Bought by
Davis Alyssa A
Current Estimated Value
Purchase Details
Closed on
Oct 9, 2015
Sold by
Redmond Timothy J and Wood Patricia E
Bought by
Davis Alexander M and Davis Alyssa A
Home Financials for this Owner
Home Financials are based on the most recent Mortgage that was taken out on this home.
Original Mortgage
$134,027
Outstanding Balance
$105,415
Interest Rate
3.87%
Mortgage Type
FHA
Estimated Equity
$166,043
Purchase Details
Closed on
Jun 13, 2003
Sold by
Emswiler Elwood F and Emswiler Phyllis E
Bought by
Redwood Timothy J and Wood Patricia E
Home Financials for this Owner
Home Financials are based on the most recent Mortgage that was taken out on this home.
Original Mortgage
$120,258
Interest Rate
5.78%
Mortgage Type
VA
Purchase Details
Closed on
Oct 1, 1978
Bought by
Plank Phyllis E
Create a Home Valuation Report for This Property
The Home Valuation Report is an in-depth analysis detailing your home's value as well as a comparison with similar homes in the area
Home Values in the Area
Average Home Value in this Area
Purchase History
| Date | Buyer | Sale Price | Title Company |
|---|---|---|---|
| Davis Alyssa A | -- | None Available | |
| Davis Alexander M | $136,500 | Attorney | |
| Redwood Timothy J | $117,900 | -- | |
| Plank Phyllis E | $53,900 | -- |
Source: Public Records
Mortgage History
| Date | Status | Borrower | Loan Amount |
|---|---|---|---|
| Open | Davis Alexander M | $134,027 | |
| Previous Owner | Redwood Timothy J | $120,258 |
Source: Public Records
Tax History Compared to Growth
Tax History
| Year | Tax Paid | Tax Assessment Tax Assessment Total Assessment is a certain percentage of the fair market value that is determined by local assessors to be the total taxable value of land and additions on the property. | Land | Improvement |
|---|---|---|---|---|
| 2024 | $3,452 | $69,340 | $20,480 | $48,860 |
| 2023 | $3,452 | $69,340 | $20,480 | $48,860 |
| 2022 | $3,146 | $69,340 | $20,480 | $48,860 |
| 2021 | $2,669 | $53,340 | $15,750 | $37,590 |
| 2020 | $2,702 | $53,340 | $15,750 | $37,590 |
| 2019 | $2,726 | $53,340 | $15,750 | $37,590 |
| 2018 | $2,222 | $40,570 | $12,290 | $28,280 |
| 2017 | $2,230 | $40,570 | $12,290 | $28,280 |
| 2016 | $2,156 | $40,570 | $12,290 | $28,280 |
| 2015 | $1,882 | $37,560 | $11,380 | $26,180 |
| 2014 | $1,882 | $37,560 | $11,380 | $26,180 |
| 2013 | $1,892 | $37,560 | $11,380 | $26,180 |
Source: Public Records
Map
Nearby Homes
- 527 Bellaire Dr
- 704 Shoshoni Way
- 389 N Garber Dr
- 397 Miles Ave
- 1013 Arapaho Trail
- 140 Hartman Ave
- 28 Warner Dr
- 1414 Ohio 571
- 000 Kinna Dr
- 6201 S Co Road 25a
- 36 Regency Square
- 559 W Broadway St
- 381 N 4th St
- 720 E Kessler Cowlesville Rd
- 0 Crane Rd
- 100 Wunderwood Dr
- 0 Ohio 571
- 760 Rosedale Dr
- 5700 S Co Road 25a
- 703 Nelson Ct