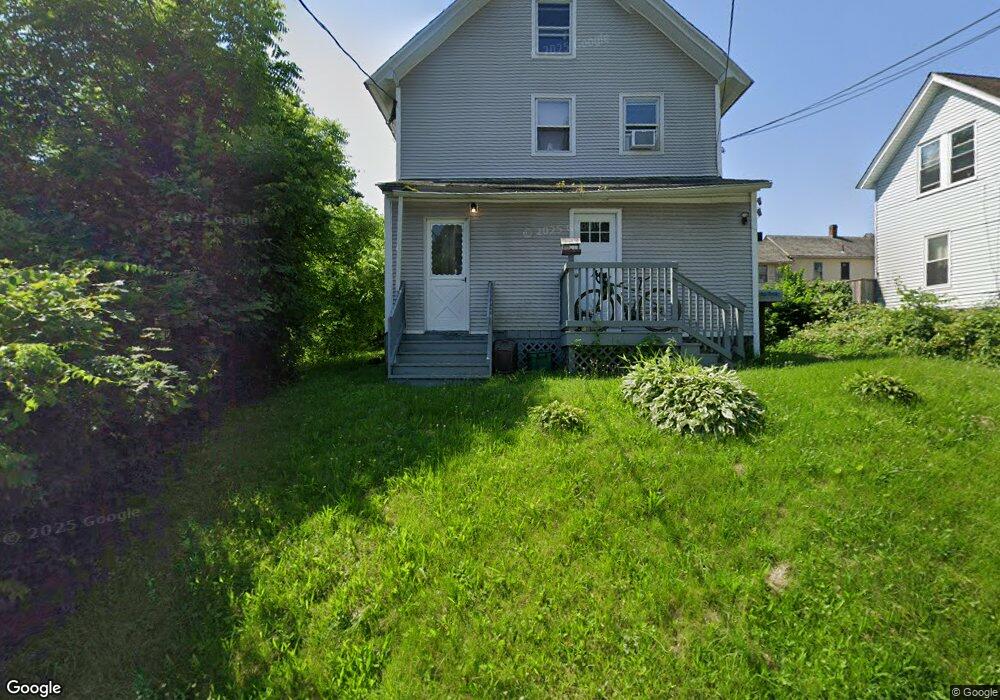
20 Arch St Greenfield, MA 01301
Estimated Value: $261,000 - $327,000
4
Beds
3
Baths
1,988
Sq Ft
$143/Sq Ft
Est. Value
About This Home
This home is located at 20 Arch St, Greenfield, MA 01301 and is currently estimated at $283,667, approximately $142 per square foot. 20 Arch St is a home located in Franklin County with nearby schools including Cornerstone Christian School and Holy Trinity School.
Ownership History
Date
Name
Owned For
Owner Type
Purchase Details
Closed on
Feb 28, 2019
Sold by
Martino Anthony
Bought by
Benegan 2 Llc
Current Estimated Value
Home Financials for this Owner
Home Financials are based on the most recent Mortgage that was taken out on this home.
Original Mortgage
$804,000
Outstanding Balance
$703,979
Interest Rate
4.4%
Mortgage Type
Undefined Multiple Amounts
Estimated Equity
-$420,312
Purchase Details
Closed on
Apr 6, 2018
Sold by
Deutsche Bk Natl T Co
Bought by
Martino Anthony
Purchase Details
Closed on
Jul 31, 2003
Sold by
Rosewarne James M
Bought by
Rosewarne James M and Rosewarne Jennifer
Purchase Details
Closed on
Nov 9, 1999
Sold by
Rosewarne James M and Rosewarne Daniel G
Bought by
Rosewarne James M
Create a Home Valuation Report for This Property
The Home Valuation Report is an in-depth analysis detailing your home's value as well as a comparison with similar homes in the area
Home Values in the Area
Average Home Value in this Area
Purchase History
| Date | Buyer | Sale Price | Title Company |
|---|---|---|---|
| Benegan 2 Llc | -- | -- | |
| Benegan 2 Llc | -- | -- | |
| Martino Anthony | $63,700 | -- | |
| Martino Anthony | $63,700 | -- | |
| Rosewarne James M | -- | -- | |
| Rosewarne James M | -- | -- | |
| Rosewarne James M | $34,000 | -- | |
| Rosewarne James M | $34,000 | -- |
Source: Public Records
Mortgage History
| Date | Status | Borrower | Loan Amount |
|---|---|---|---|
| Open | Benegan 2 Llc | $804,000 | |
| Closed | Benegan 2 Llc | $804,000 | |
| Previous Owner | Rosewarne James M | $16,985 | |
| Previous Owner | Rosewarne James M | $11,828 |
Source: Public Records
Tax History Compared to Growth
Tax History
| Year | Tax Paid | Tax Assessment Tax Assessment Total Assessment is a certain percentage of the fair market value that is determined by local assessors to be the total taxable value of land and additions on the property. | Land | Improvement |
|---|---|---|---|---|
| 2025 | $4,368 | $223,300 | $45,700 | $177,600 |
| 2024 | $4,445 | $218,000 | $41,800 | $176,200 |
| 2023 | $4,254 | $216,500 | $41,800 | $174,700 |
| 2022 | $4,194 | $187,900 | $39,800 | $148,100 |
| 2021 | $4,089 | $176,100 | $42,800 | $133,300 |
| 2020 | $3,946 | $172,100 | $38,800 | $133,300 |
| 2019 | $3,736 | $167,100 | $33,800 | $133,300 |
| 2018 | $3,667 | $163,500 | $33,100 | $130,400 |
| 2017 | $3,553 | $163,500 | $33,100 | $130,400 |
| 2016 | $3,415 | $156,600 | $28,800 | $127,800 |
| 2015 | $3,370 | $149,700 | $29,200 | $120,500 |
| 2014 | $3,075 | $149,800 | $29,200 | $120,600 |
Source: Public Records
Map
Nearby Homes