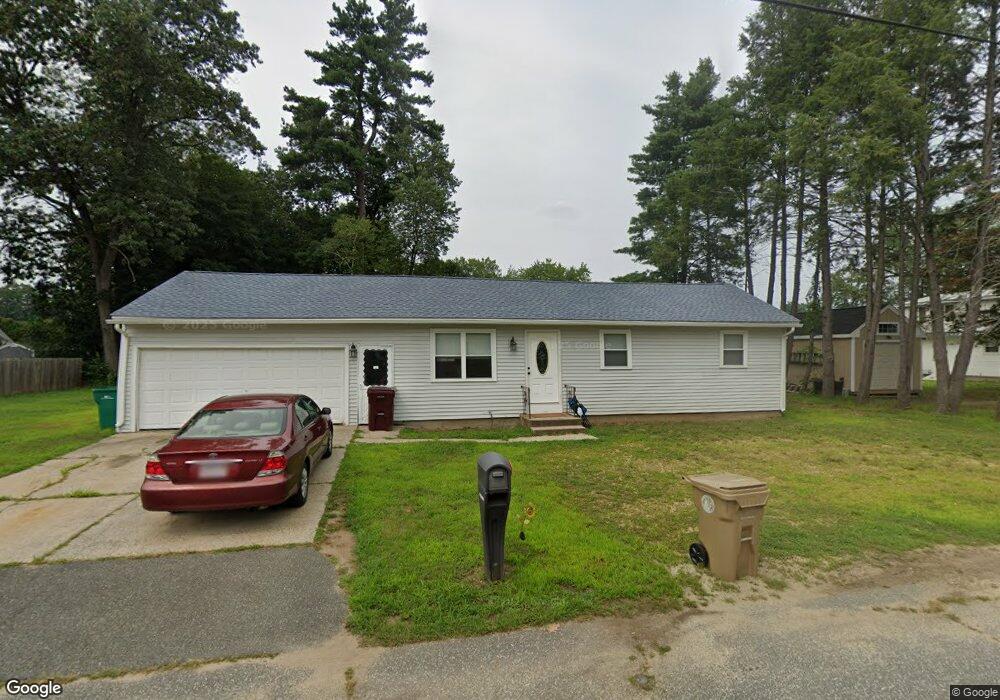
20 Austin St Ludlow, MA 01056
Estimated Value: $265,000 - $292,489
4
Beds
1
Bath
912
Sq Ft
$306/Sq Ft
Est. Value
About This Home
This home is located at 20 Austin St, Ludlow, MA 01056 and is currently estimated at $279,372, approximately $306 per square foot. 20 Austin St is a home located in Hampden County with nearby schools including East Street Elementary School, Chapin Street Elementary School, and Paul R. Baird Middle School.
Ownership History
Date
Name
Owned For
Owner Type
Purchase Details
Closed on
Oct 5, 2022
Sold by
Maynard Robert I and Maynard Deborah J
Bought by
Maynard Michael
Current Estimated Value
Home Financials for this Owner
Home Financials are based on the most recent Mortgage that was taken out on this home.
Original Mortgage
$150,000
Outstanding Balance
$143,453
Interest Rate
5.55%
Mortgage Type
Purchase Money Mortgage
Estimated Equity
$135,919
Purchase Details
Closed on
Sep 14, 2022
Sold by
Maynard Gloria Est and Maynard
Bought by
Maynard Michael D and Maynard Robert I
Home Financials for this Owner
Home Financials are based on the most recent Mortgage that was taken out on this home.
Original Mortgage
$150,000
Outstanding Balance
$143,453
Interest Rate
5.55%
Mortgage Type
Purchase Money Mortgage
Estimated Equity
$135,919
Create a Home Valuation Report for This Property
The Home Valuation Report is an in-depth analysis detailing your home's value as well as a comparison with similar homes in the area
Home Values in the Area
Average Home Value in this Area
Purchase History
| Date | Buyer | Sale Price | Title Company |
|---|---|---|---|
| Maynard Michael | $75,000 | None Available | |
| Maynard Michael | $75,000 | None Available | |
| Maynard Michael D | -- | None Available | |
| Maynard Michael D | -- | None Available |
Source: Public Records
Mortgage History
| Date | Status | Borrower | Loan Amount |
|---|---|---|---|
| Open | Maynard Michael | $150,000 | |
| Closed | Maynard Michael | $150,000 |
Source: Public Records
Tax History
| Year | Tax Paid | Tax Assessment Tax Assessment Total Assessment is a certain percentage of the fair market value that is determined by local assessors to be the total taxable value of land and additions on the property. | Land | Improvement |
|---|---|---|---|---|
| 2025 | $4,018 | $231,600 | $85,200 | $146,400 |
| 2024 | $3,916 | $216,500 | $85,200 | $131,300 |
| 2023 | $3,734 | $191,400 | $78,000 | $113,400 |
| 2022 | $3,352 | $167,700 | $71,500 | $96,200 |
| 2021 | $1,652 | $161,900 | $71,500 | $90,400 |
| 2020 | $3,303 | $160,200 | $70,400 | $89,800 |
| 2019 | $3,094 | $156,100 | $69,800 | $86,300 |
| 2018 | $2,931 | $154,200 | $69,800 | $84,400 |
| 2017 | $2,865 | $154,600 | $68,400 | $86,200 |
| 2016 | $2,723 | $150,200 | $67,000 | $83,200 |
| 2015 | $2,580 | $149,200 | $66,300 | $82,900 |
Source: Public Records
Map
Nearby Homes
- 61 Massachusetts Ave
- 382 Holyoke St
- 436 Holyoke St
- 482 Holyoke St
- 350 West St Unit 19
- 98 Fuller St Unit 32
- 15 Hilltop Terrace
- 70 Fuller St
- 42 Loopley St
- 42 Roy St
- 0 Fuller St Unit 73409741
- 353 Fuller St Unit 8
- 84 Chapin Greene Dr
- 32 White St
- 12 Mariana Way
- 81-83 Motyka St
- 59 Prospect Gardens
- '0' Rood St
- 50 Warsaw Ave
- 166-168 Main St
- 32 Austin St
- 3 Auburn St
- 355 Holyoke St
- 23 Austin St
- 38 Atlantic St
- 33 Austin St
- 349 Holyoke St
- 8 Auburn St
- 36 Massachusetts Ave
- 26 Massachusetts Ave
- 54 Atlantic St
- 54 Massachusetts Ave
- 35 Atlantic St
- 5 Atlantic St
- 356 Holyoke St
- 360 Holyoke St
- 352 Holyoke St
- 27 Mass Ave
- 45 Atlantic St
- 106 Alfred St