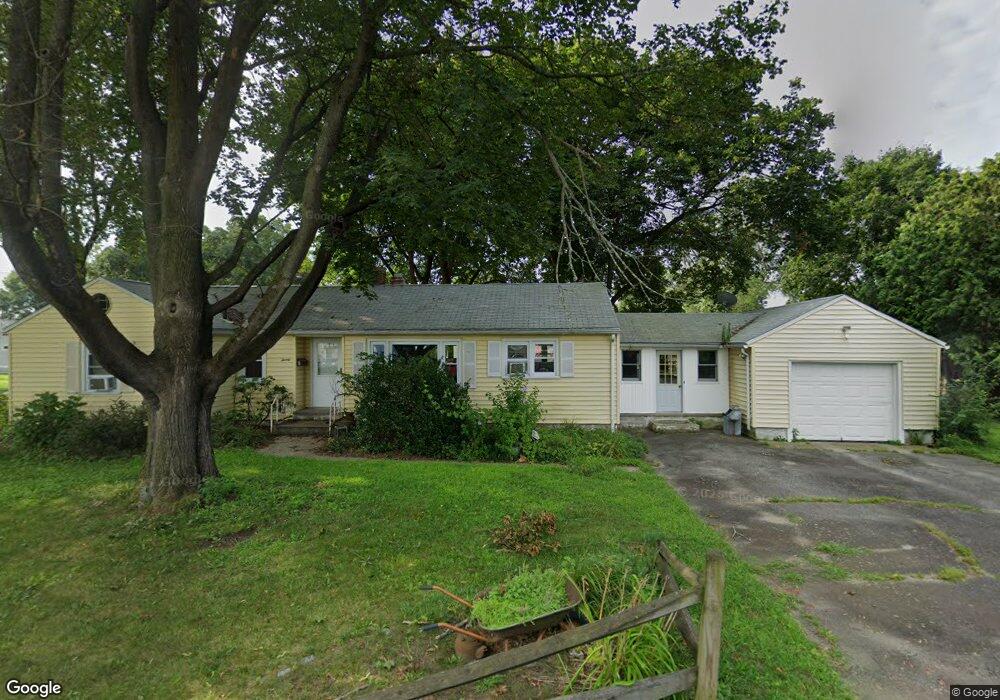
20 Baker St Ludlow, MA 01056
Estimated Value: $304,000 - $373,000
3
Beds
2
Baths
1,126
Sq Ft
$287/Sq Ft
Est. Value
About This Home
This home is located at 20 Baker St, Ludlow, MA 01056 and is currently estimated at $322,886, approximately $286 per square foot. 20 Baker St is a home located in Hampden County with nearby schools including East Street Elementary School, Chapin Street Elementary School, and Paul R. Baird Middle School.
Ownership History
Date
Name
Owned For
Owner Type
Purchase Details
Closed on
Nov 17, 2021
Sold by
Bourcier Marian C
Bought by
Bourcier Marian C and White John
Current Estimated Value
Purchase Details
Closed on
Jan 30, 2018
Sold by
Swienton Robert Est and White
Bought by
Bourcier Marian C
Home Financials for this Owner
Home Financials are based on the most recent Mortgage that was taken out on this home.
Original Mortgage
$66,120
Interest Rate
3.93%
Mortgage Type
New Conventional
Purchase Details
Closed on
Nov 6, 1963
Bought by
Swienton Robert L and Swienton Lorraine M
Create a Home Valuation Report for This Property
The Home Valuation Report is an in-depth analysis detailing your home's value as well as a comparison with similar homes in the area
Home Values in the Area
Average Home Value in this Area
Purchase History
| Date | Buyer | Sale Price | Title Company |
|---|---|---|---|
| Bourcier Marian C | -- | None Available | |
| Bourcier Marian C | -- | None Available | |
| Bourcier Marian C | $82,650 | -- | |
| Bourcier Marian C | $82,650 | -- | |
| Swienton Robert L | $15,000 | -- |
Source: Public Records
Mortgage History
| Date | Status | Borrower | Loan Amount |
|---|---|---|---|
| Previous Owner | Bourcier Marian C | $66,120 | |
| Previous Owner | Swienton Robert L | $85,000 | |
| Previous Owner | Swienton Robert L | $80,000 | |
| Previous Owner | Swienton Robert L | $80,000 |
Source: Public Records
Tax History
| Year | Tax Paid | Tax Assessment Tax Assessment Total Assessment is a certain percentage of the fair market value that is determined by local assessors to be the total taxable value of land and additions on the property. | Land | Improvement |
|---|---|---|---|---|
| 2025 | $4,180 | $240,900 | $75,800 | $165,100 |
| 2024 | $4,007 | $221,500 | $75,700 | $145,800 |
| 2023 | $3,771 | $193,300 | $66,500 | $126,800 |
| 2022 | $3,592 | $179,700 | $66,500 | $113,200 |
| 2021 | $3,605 | $171,000 | $66,500 | $104,500 |
| 2020 | $3,454 | $167,500 | $65,400 | $102,100 |
| 2019 | $3,211 | $162,000 | $64,800 | $97,200 |
| 2018 | $3,009 | $158,300 | $64,800 | $93,500 |
| 2017 | $2,907 | $156,900 | $62,900 | $94,000 |
| 2016 | $2,734 | $150,800 | $61,600 | $89,200 |
| 2015 | $2,568 | $148,500 | $61,000 | $87,500 |
Source: Public Records
Map
Nearby Homes
- 162 Highland Ave
- 0 Fuller St Unit 73409741
- 59 Prospect St
- 31 Greenwich St
- 70 Fuller St
- 39 Rogers Ave
- 287 East St
- 26 Swan Ave
- 98 Fuller St Unit 32
- 0 Center St Unit 73415933
- 42 Loopley St
- 374 East St
- 119 Blisswood Village Dr
- 102 Swan Ave
- 45 Canterbury St
- 57 Belmont St
- 37 Franklin St
- 84 Chapin Greene Dr
- 12 Weston St
- 4-6 Dalton St
Your Personal Tour Guide
Ask me questions while you tour the home.