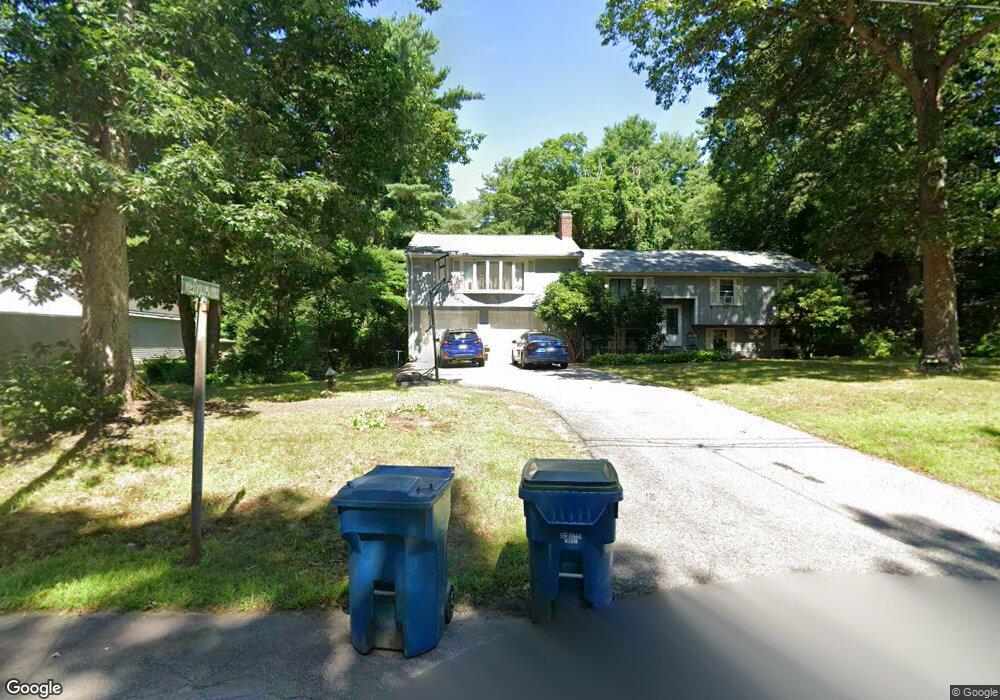
20 Barrows Ct Norton, MA 02766
Estimated Value: $636,401 - $732,000
4
Beds
3
Baths
1,750
Sq Ft
$383/Sq Ft
Est. Value
About This Home
This home is located at 20 Barrows Ct, Norton, MA 02766 and is currently estimated at $670,850, approximately $383 per square foot. 20 Barrows Ct is a home located in Bristol County with nearby schools including J.C. Solmonese Elementary School, Henri A. Yelle Elementary School, and Norton Middle School.
Ownership History
Date
Name
Owned For
Owner Type
Purchase Details
Closed on
Oct 23, 2003
Sold by
Bahery Michael A and Galliani Vincent
Bought by
Mervilus Charles and Lafontant Louna
Current Estimated Value
Home Financials for this Owner
Home Financials are based on the most recent Mortgage that was taken out on this home.
Original Mortgage
$318,250
Outstanding Balance
$147,903
Interest Rate
6.15%
Mortgage Type
Purchase Money Mortgage
Estimated Equity
$522,947
Purchase Details
Closed on
Oct 20, 1994
Sold by
Barros Ronald J and Barros Kay E
Bought by
Purvy Robert D and Purvy Joyce L
Home Financials for this Owner
Home Financials are based on the most recent Mortgage that was taken out on this home.
Original Mortgage
$156,750
Interest Rate
8.49%
Mortgage Type
Purchase Money Mortgage
Create a Home Valuation Report for This Property
The Home Valuation Report is an in-depth analysis detailing your home's value as well as a comparison with similar homes in the area
Home Values in the Area
Average Home Value in this Area
Purchase History
| Date | Buyer | Sale Price | Title Company |
|---|---|---|---|
| Mervilus Charles | $335,000 | -- | |
| Purvy Robert D | $165,000 | -- |
Source: Public Records
Mortgage History
| Date | Status | Borrower | Loan Amount |
|---|---|---|---|
| Open | Mervilus Charles | $318,250 | |
| Previous Owner | Purvy Robert D | $212,250 | |
| Previous Owner | Purvy Robert D | $156,750 | |
| Previous Owner | Purvy Robert D | $42,000 | |
| Previous Owner | Purvy Robert D | $30,000 |
Source: Public Records
Tax History
| Year | Tax Paid | Tax Assessment Tax Assessment Total Assessment is a certain percentage of the fair market value that is determined by local assessors to be the total taxable value of land and additions on the property. | Land | Improvement |
|---|---|---|---|---|
| 2025 | $74 | $570,900 | $187,700 | $383,200 |
| 2024 | $7,040 | $543,600 | $178,700 | $364,900 |
| 2023 | $6,664 | $513,000 | $168,600 | $344,400 |
| 2022 | $6,487 | $454,900 | $153,200 | $301,700 |
| 2021 | $107 | $408,900 | $146,000 | $262,900 |
| 2020 | $7,152 | $397,100 | $141,700 | $255,400 |
| 2019 | $6,668 | $379,100 | $136,300 | $242,800 |
| 2018 | $5,447 | $359,300 | $136,300 | $223,000 |
| 2017 | $6,215 | $333,500 | $136,300 | $197,200 |
| 2016 | $4,970 | $318,400 | $136,300 | $182,100 |
| 2015 | $4,791 | $311,300 | $133,600 | $177,700 |
| 2014 | $4,952 | $322,200 | $152,700 | $169,500 |
Source: Public Records
Map
Nearby Homes
- 26 Barrows Ct
- 34 Barrows St
- 170 S Worcester St Unit 3
- 2 Edgewater Dr Unit 2
- 108 S Worcester St
- 5 Robin Cir Unit 5
- 127 John Scott Blvd
- 125 John Scott Blvd
- 20 Lloyd Cir Unit 32
- 14 Lloyd Cir Unit 29
- 93 Mansfield Ave
- 90 Pine St
- 29 Germain Way Unit 3
- 143 Oak St Unit 10
- 152 Pine St Unit 23
- 3 Gilberts Way
- 65 Godfrey Dr Unit 65
- 95 Godfrey Dr
- 343 Godfrey Dr
- 157 Mansfield Ave Unit 14
Your Personal Tour Guide
Ask me questions while you tour the home.