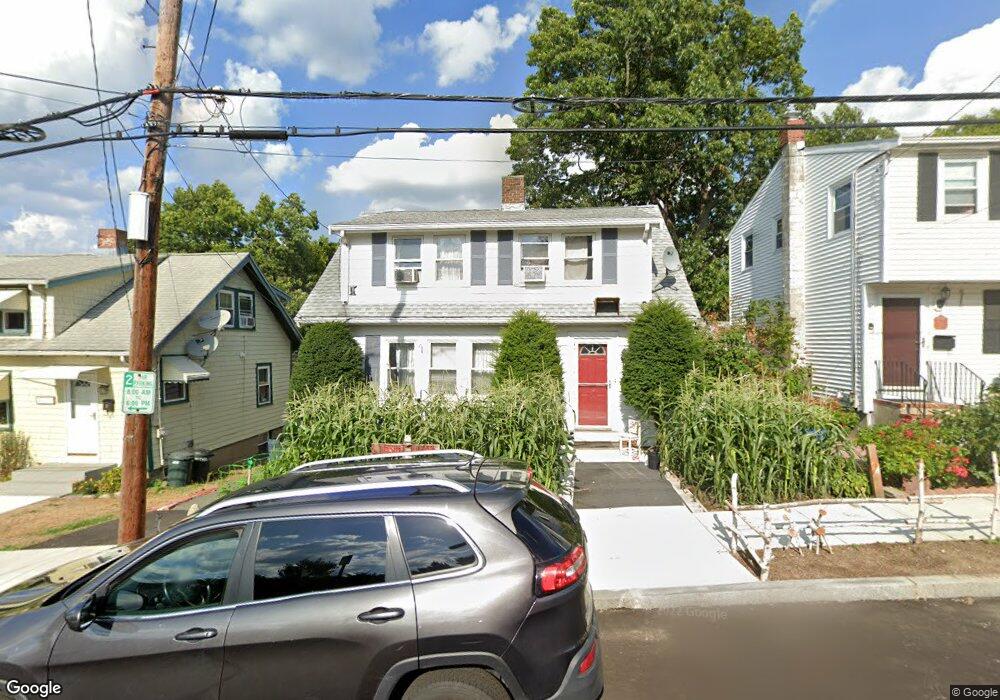
20 Becket St Quincy, MA 02171
Montclair NeighborhoodEstimated Value: $610,000 - $706,000
3
Beds
1
Bath
1,480
Sq Ft
$445/Sq Ft
Est. Value
About This Home
This home is located at 20 Becket St, Quincy, MA 02171 and is currently estimated at $657,963, approximately $444 per square foot. 20 Becket St is a home located in Norfolk County with nearby schools including Montclair Elementary School, Atlantic Middle School, and North Quincy High School.
Ownership History
Date
Name
Owned For
Owner Type
Purchase Details
Closed on
Apr 8, 2016
Sold by
Marshall Thomas W and Curran Erin
Bought by
Marshall Thomas W
Current Estimated Value
Purchase Details
Closed on
Aug 26, 2004
Sold by
Marshall Thomas W
Bought by
Curran Erin and Marchall Thomas W
Create a Home Valuation Report for This Property
The Home Valuation Report is an in-depth analysis detailing your home's value as well as a comparison with similar homes in the area
Home Values in the Area
Average Home Value in this Area
Purchase History
| Date | Buyer | Sale Price | Title Company |
|---|---|---|---|
| Marshall Thomas W | -- | -- | |
| Curran Erin | -- | -- |
Source: Public Records
Mortgage History
| Date | Status | Borrower | Loan Amount |
|---|---|---|---|
| Previous Owner | Curran Erin | $150,000 |
Source: Public Records
Tax History Compared to Growth
Tax History
| Year | Tax Paid | Tax Assessment Tax Assessment Total Assessment is a certain percentage of the fair market value that is determined by local assessors to be the total taxable value of land and additions on the property. | Land | Improvement |
|---|---|---|---|---|
| 2025 | $6,262 | $543,100 | $316,000 | $227,100 |
| 2024 | $6,096 | $540,900 | $316,000 | $224,900 |
| 2023 | $5,689 | $511,100 | $300,900 | $210,200 |
| 2022 | $5,505 | $459,500 | $261,700 | $197,800 |
| 2021 | $5,350 | $440,700 | $249,200 | $191,500 |
| 2020 | $5,342 | $429,800 | $249,200 | $180,600 |
| 2019 | $4,921 | $392,100 | $232,900 | $159,200 |
| 2018 | $4,918 | $368,700 | $215,700 | $153,000 |
| 2017 | $4,755 | $335,600 | $205,400 | $130,200 |
| 2016 | $4,321 | $300,900 | $178,600 | $122,300 |
| 2015 | $4,012 | $274,800 | $162,400 | $112,400 |
| 2014 | $3,715 | $250,000 | $154,700 | $95,300 |
Source: Public Records
Map
Nearby Homes
- 115 W Squantum St Unit 907
- 115 W Squantum St Unit 810
- 17 Holmes St Unit 2
- 17 Holmes St Unit 4
- 60 Newbury St Unit 10
- 85 E Squantum St Unit 10
- 51 Denmark Ave
- 45 Hancock St Unit 203
- 133 Commander Shea Blvd Unit 315
- 133 Commander Shea Blvd Unit 609
- 133 Commander Shea Blvd Unit 620
- 133 Commander Shea Blvd Unit 204
- 68 Atlantic St
- 91 Atlantic St
- 143 Arlington St
- 90 Quincy Shore Dr Unit 701
- 90 Quincy Shore Dr Unit 501
- 90 Shore Ave
- 38 Walker St
- 522 Hancock St