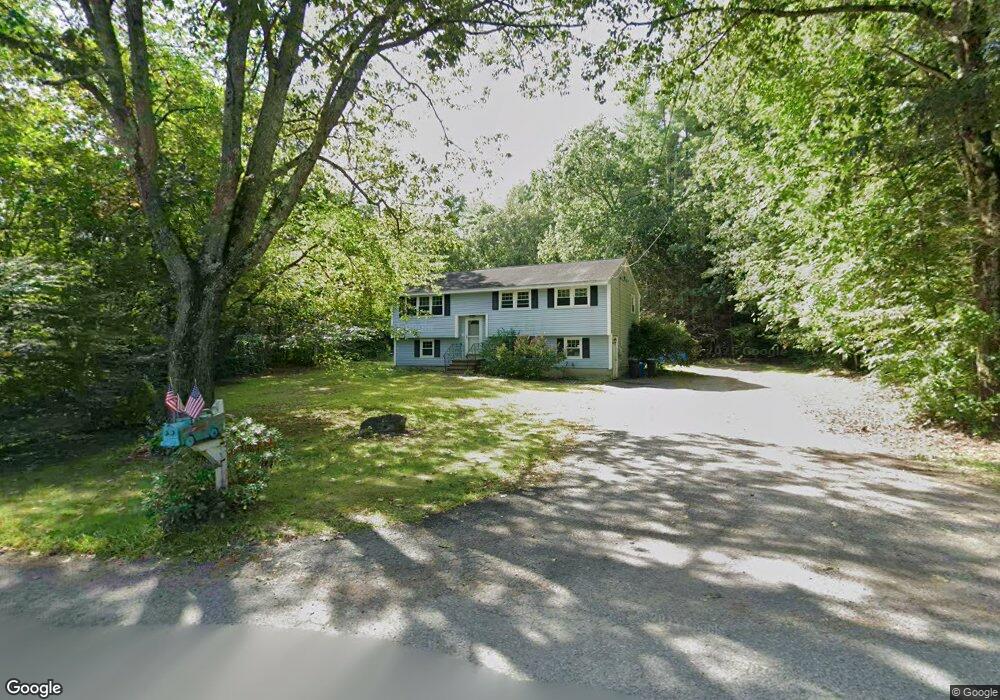
20 Bemis Rd Pepperell, MA 01463
Estimated Value: $498,200 - $540,000
3
Beds
1
Bath
1,300
Sq Ft
$394/Sq Ft
Est. Value
About This Home
This home is located at 20 Bemis Rd, Pepperell, MA 01463 and is currently estimated at $512,050, approximately $393 per square foot. 20 Bemis Rd is a home located in Middlesex County with nearby schools including North Middlesex Regional High School and Maple Dene & Moppet School.
Ownership History
Date
Name
Owned For
Owner Type
Purchase Details
Closed on
Nov 1, 1996
Sold by
Clark George E
Bought by
Wyld Peter J and Wyld Laura
Current Estimated Value
Home Financials for this Owner
Home Financials are based on the most recent Mortgage that was taken out on this home.
Original Mortgage
$126,534
Interest Rate
8.07%
Mortgage Type
Purchase Money Mortgage
Purchase Details
Closed on
Dec 1, 1995
Sold by
Quattrochi Francis and Reichle Lynne
Bought by
Clark George E
Home Financials for this Owner
Home Financials are based on the most recent Mortgage that was taken out on this home.
Original Mortgage
$77,600
Interest Rate
7.37%
Mortgage Type
Purchase Money Mortgage
Create a Home Valuation Report for This Property
The Home Valuation Report is an in-depth analysis detailing your home's value as well as a comparison with similar homes in the area
Home Values in the Area
Average Home Value in this Area
Purchase History
| Date | Buyer | Sale Price | Title Company |
|---|---|---|---|
| Wyld Peter J | $128,500 | -- | |
| Clark George E | $97,000 | -- |
Source: Public Records
Mortgage History
| Date | Status | Borrower | Loan Amount |
|---|---|---|---|
| Open | Clark George E | $124,600 | |
| Closed | Clark George E | $126,534 | |
| Previous Owner | Clark George E | $77,600 |
Source: Public Records
Tax History Compared to Growth
Tax History
| Year | Tax Paid | Tax Assessment Tax Assessment Total Assessment is a certain percentage of the fair market value that is determined by local assessors to be the total taxable value of land and additions on the property. | Land | Improvement |
|---|---|---|---|---|
| 2025 | $5,763 | $393,900 | $142,900 | $251,000 |
| 2024 | $5,236 | $364,900 | $129,300 | $235,600 |
| 2023 | $5,145 | $339,800 | $129,300 | $210,500 |
| 2022 | $4,648 | $271,000 | $102,100 | $168,900 |
| 2021 | $4,545 | $253,600 | $88,400 | $165,200 |
| 2020 | $15,037 | $253,600 | $88,400 | $165,200 |
| 2019 | $13,532 | $242,000 | $88,400 | $153,600 |
| 2018 | $13,063 | $225,300 | $88,400 | $136,900 |
| 2017 | $3,418 | $215,100 | $88,400 | $126,700 |
| 2016 | $3,265 | $197,500 | $88,400 | $109,100 |
| 2015 | $3,150 | $197,500 | $88,400 | $109,100 |
| 2014 | $3,047 | $192,100 | $88,400 | $103,700 |
Source: Public Records
Map
Nearby Homes