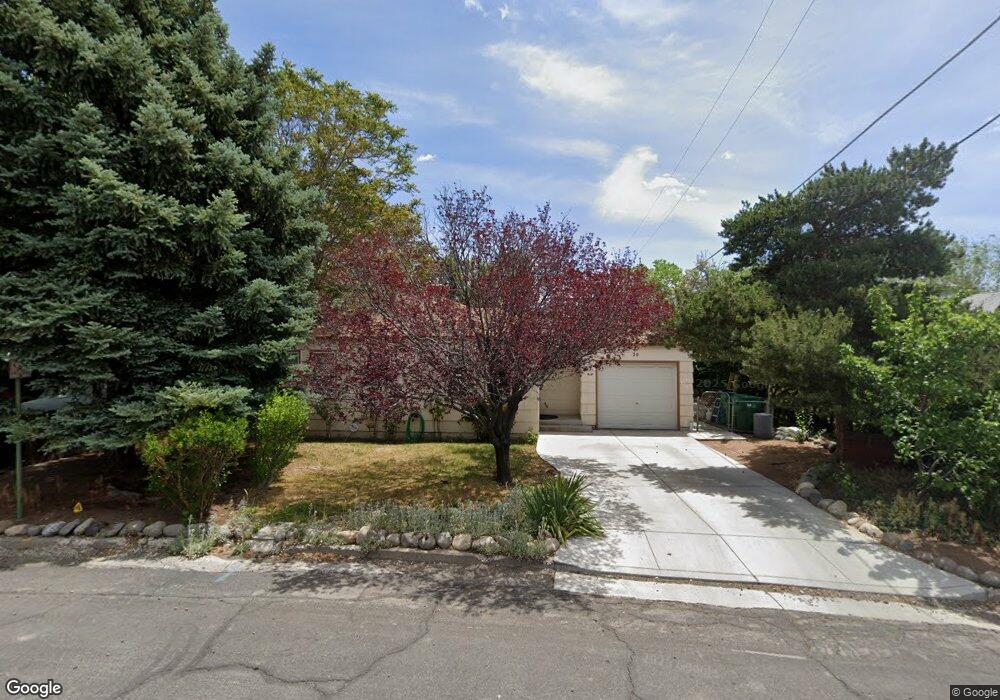
20 Bisby St Reno, NV 89512
West University NeighborhoodEstimated Value: $310,695 - $401,000
2
Beds
1
Bath
822
Sq Ft
$430/Sq Ft
Est. Value
About This Home
This home is located at 20 Bisby St, Reno, NV 89512 and is currently estimated at $353,424, approximately $429 per square foot. 20 Bisby St is a home located in Washoe County with nearby schools including Dorothy Lemelson STEM Academy Elementary School, Fred W. Traner Middle School, and Procter R. Hug High School.
Ownership History
Date
Name
Owned For
Owner Type
Purchase Details
Closed on
Apr 26, 2023
Sold by
Mckay Wallace A and Mckay Kathy A
Bought by
Sertic Mckay Trust
Current Estimated Value
Purchase Details
Closed on
Jan 6, 2000
Sold by
Kane Jeffrey L
Bought by
Mckay Wallace A and Sertic Kathy A
Home Financials for this Owner
Home Financials are based on the most recent Mortgage that was taken out on this home.
Original Mortgage
$78,400
Interest Rate
8.16%
Purchase Details
Closed on
Aug 2, 1994
Sold by
Berinati Donald J
Bought by
Lane Jeffrey L and Lane Louis R
Home Financials for this Owner
Home Financials are based on the most recent Mortgage that was taken out on this home.
Original Mortgage
$71,200
Interest Rate
8.8%
Create a Home Valuation Report for This Property
The Home Valuation Report is an in-depth analysis detailing your home's value as well as a comparison with similar homes in the area
Home Values in the Area
Average Home Value in this Area
Purchase History
| Date | Buyer | Sale Price | Title Company |
|---|---|---|---|
| Sertic Mckay Trust | -- | None Listed On Document | |
| Mckay Wallace A | $98,000 | Stewart Title Company | |
| Lane Jeffrey L | -- | Stewart Title Company | |
| Lane Jeffrey L | $89,000 | Stewart Title |
Source: Public Records
Mortgage History
| Date | Status | Borrower | Loan Amount |
|---|---|---|---|
| Previous Owner | Mckay Wallace A | $78,400 | |
| Previous Owner | Lane Jeffrey L | $71,200 |
Source: Public Records
Tax History Compared to Growth
Tax History
| Year | Tax Paid | Tax Assessment Tax Assessment Total Assessment is a certain percentage of the fair market value that is determined by local assessors to be the total taxable value of land and additions on the property. | Land | Improvement |
|---|---|---|---|---|
| 2025 | $541 | $41,017 | $28,795 | $12,223 |
| 2024 | $541 | $38,831 | $27,032 | $11,799 |
| 2023 | $525 | $40,158 | $29,227 | $10,932 |
| 2022 | $511 | $31,859 | $22,943 | $8,916 |
| 2021 | $496 | $23,841 | $15,162 | $8,679 |
| 2020 | $480 | $22,710 | $14,198 | $8,512 |
| 2019 | $463 | $22,460 | $14,397 | $8,063 |
| 2018 | $437 | $17,463 | $9,742 | $7,721 |
| 2017 | $421 | $15,525 | $7,947 | $7,578 |
| 2016 | $409 | $14,524 | $6,916 | $7,608 |
| 2015 | $411 | $12,802 | $5,353 | $7,449 |
| 2014 | $398 | $11,177 | $4,156 | $7,021 |
| 2013 | -- | $10,474 | $3,605 | $6,869 |
Source: Public Records
Map
Nearby Homes
- 99 Bartlett St
- 1725 Sterling Way
- 496 Highland Ave
- 540 Cranleigh Dr
- 565 Denslowe Dr
- 1341 N Virginia St
- 2007 Valley Rd
- 462 Laurel St
- 1449 Hillside Dr
- 250 College Dr
- 1035 N Sierra St
- 595 College Dr
- 344 E 7th St
- 442 E 7th St Unit 1 & 2
- 336 E 7th St
- 440 E 7th St
- 650 Elko Ave
- 656 Eureka Ave
- 1680 Sutro St
- 668 Spokane St