20 Breton St Biddeford, ME 04005
Estimated Value: $503,000 - $559,000
3
Beds
2
Baths
1,768
Sq Ft
$298/Sq Ft
Est. Value
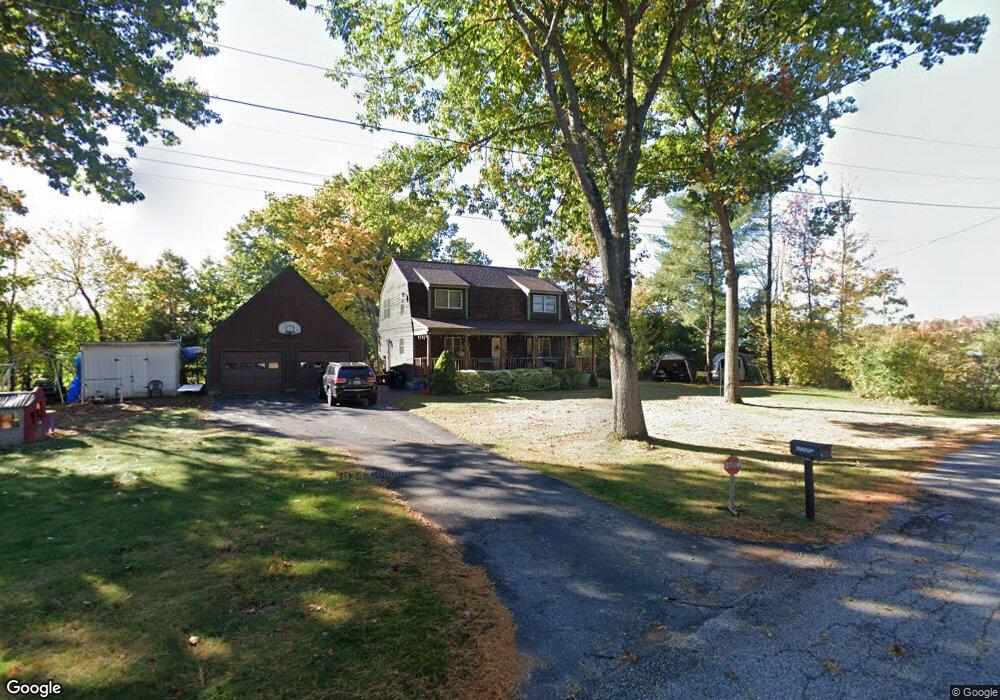
About This Home
This home is located at 20 Breton St, Biddeford, ME 04005 and is currently estimated at $527,079, approximately $298 per square foot. 20 Breton St is a home located in York County with nearby schools including John F Kennedy Memorial School, Biddeford Primary School, and Biddeford Intermediate School.
Ownership History
Date
Name
Owned For
Owner Type
Purchase Details
Closed on
May 21, 2019
Sold by
Tardif Marc R
Bought by
Tardif Melanie J and Tardif Marc R
Current Estimated Value
Home Financials for this Owner
Home Financials are based on the most recent Mortgage that was taken out on this home.
Original Mortgage
$100,000
Outstanding Balance
$87,742
Interest Rate
4.1%
Mortgage Type
Stand Alone Refi Refinance Of Original Loan
Estimated Equity
$439,337
Create a Home Valuation Report for This Property
The Home Valuation Report is an in-depth analysis detailing your home's value as well as a comparison with similar homes in the area
Home Values in the Area
Average Home Value in this Area
Purchase History
| Date | Buyer | Sale Price | Title Company |
|---|---|---|---|
| Tardif Melanie J | -- | -- | |
| Tardif Melanie J | -- | -- |
Source: Public Records
Mortgage History
| Date | Status | Borrower | Loan Amount |
|---|---|---|---|
| Open | Tardif Melanie J | $100,000 | |
| Closed | Tardif Melanie J | $100,000 |
Source: Public Records
Tax History Compared to Growth
Tax History
| Year | Tax Paid | Tax Assessment Tax Assessment Total Assessment is a certain percentage of the fair market value that is determined by local assessors to be the total taxable value of land and additions on the property. | Land | Improvement |
|---|---|---|---|---|
| 2024 | $5,540 | $389,600 | $167,700 | $221,900 |
| 2023 | $5,074 | $386,700 | $164,800 | $221,900 |
| 2022 | $4,493 | $273,800 | $78,800 | $195,000 |
| 2021 | $4,231 | $232,100 | $66,700 | $165,400 |
| 2020 | $4,269 | $212,900 | $60,600 | $152,300 |
| 2019 | $4,254 | $212,900 | $60,600 | $152,300 |
| 2018 | $4,194 | $212,900 | $60,600 | $152,300 |
| 2017 | $4,173 | $207,900 | $60,600 | $147,300 |
| 2016 | $4,129 | $207,900 | $60,600 | $147,300 |
| 2015 | $3,853 | $207,900 | $60,600 | $147,300 |
| 2014 | $3,758 | $207,900 | $60,600 | $147,300 |
| 2013 | -- | $212,300 | $56,900 | $155,400 |
Source: Public Records
Map
Nearby Homes