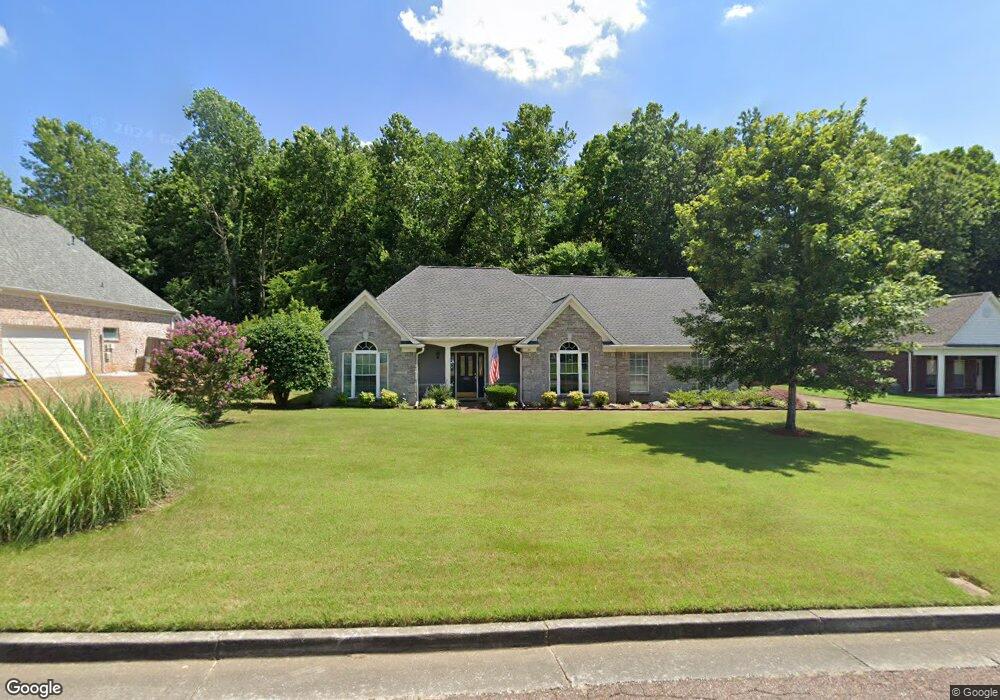
20 Brookhaven Dr Oakland, TN 38060
Estimated Value: $310,050 - $342,000
--
Bed
3
Baths
1,827
Sq Ft
$177/Sq Ft
Est. Value
About This Home
This home is located at 20 Brookhaven Dr, Oakland, TN 38060 and is currently estimated at $324,263, approximately $177 per square foot. 20 Brookhaven Dr is a home located in Fayette County with nearby schools including Oakland Elementary School, West Junior High School, and Fayette Ware Comprehensive High School.
Ownership History
Date
Name
Owned For
Owner Type
Purchase Details
Closed on
Oct 18, 2019
Sold by
Creekside Homes Llc
Bought by
Tull Matthew and Tull Laura N
Current Estimated Value
Home Financials for this Owner
Home Financials are based on the most recent Mortgage that was taken out on this home.
Original Mortgage
$286,805
Outstanding Balance
$250,739
Interest Rate
3.4%
Mortgage Type
New Conventional
Estimated Equity
$73,524
Purchase Details
Closed on
Jun 9, 2005
Sold by
Hannigan Family Trust
Bought by
Hannigan Francis
Purchase Details
Closed on
Jun 26, 2002
Sold by
Brookside Partners
Bought by
Hannigan Family Trust
Home Financials for this Owner
Home Financials are based on the most recent Mortgage that was taken out on this home.
Original Mortgage
$127,450
Interest Rate
6.77%
Create a Home Valuation Report for This Property
The Home Valuation Report is an in-depth analysis detailing your home's value as well as a comparison with similar homes in the area
Home Values in the Area
Average Home Value in this Area
Purchase History
| Date | Buyer | Sale Price | Title Company |
|---|---|---|---|
| Tull Matthew | $301,900 | Erickson Title & Closing Llc | |
| Hannigan Francis | -- | -- | |
| Hannigan Family Trust | $159,350 | -- |
Source: Public Records
Mortgage History
| Date | Status | Borrower | Loan Amount |
|---|---|---|---|
| Open | Tull Matthew | $286,805 | |
| Previous Owner | Hannigan Family Trust | $127,450 |
Source: Public Records
Tax History Compared to Growth
Tax History
| Year | Tax Paid | Tax Assessment Tax Assessment Total Assessment is a certain percentage of the fair market value that is determined by local assessors to be the total taxable value of land and additions on the property. | Land | Improvement |
|---|---|---|---|---|
| 2024 | $668 | $52,675 | $8,750 | $43,925 |
| 2023 | $1,360 | $52,675 | $0 | $0 |
| 2022 | $902 | $52,675 | $8,750 | $43,925 |
| 2021 | $902 | $52,675 | $8,750 | $43,925 |
| 2020 | $658 | $52,675 | $8,750 | $43,925 |
| 2019 | $886 | $43,675 | $7,500 | $36,175 |
| 2018 | $911 | $43,675 | $7,500 | $36,175 |
| 2017 | $777 | $43,675 | $7,500 | $36,175 |
| 2016 | $731 | $38,450 | $7,500 | $30,950 |
| 2015 | $732 | $38,450 | $7,500 | $30,950 |
| 2014 | $732 | $38,450 | $7,500 | $30,950 |
Source: Public Records
Map
Nearby Homes
- 75 Brookwood Cir
- 150 James Cove
- 225 Country Brook Dr
- 380 Marrietta Dr
- 260 Country Brook Dr
- 50 Sheraton Cove
- 155 Countryside Dr
- 175 Marrietta Dr
- 70 Country Forest Dr
- 430 Marrietta Dr
- 50 Sugalina Valley Dr
- 60 Sugalina Valley Dr
- Asher Plan at Valleybrook
- Belmont Plan at Valleybrook
- Presley II Plan at Valleybrook
- Carson Plan at Valleybrook
- Carlisle Plan at Valleybrook
- Delaney Plan at Valleybrook
- Conway Plan at Valleybrook
- 130 Valleyview Ln
- 30 Brookhaven Dr
- 40 Brookhaven Dr
- 40 Brookhaven Ln
- 25 Brookhaven Dr
- 35 Brookhaven Dr
- 65 Brookhaven Dr
- 260 Countrywood Ln
- 250 Countrywood Ln
- 50 Brookhaven Ln
- 50 Brookhaven Dr
- 240 Countrywood Ln
- 35 Countrybrook Dr
- 25 Country Brook Dr
- 25 Countrybrook Dr
- 215 Countrywood Ln
- 60 Brookhaven Ln
- 230 Countrywood Ln
- 60 Brookhaven Dr
- 75 Brookhaven Dr
- 70 Brookhaven Ln