20 Buswell Park Newton, MA 02458
Newton Corner NeighborhoodEstimated Value: $1,273,031 - $1,758,000
4
Beds
2
Baths
1,544
Sq Ft
$959/Sq Ft
Est. Value
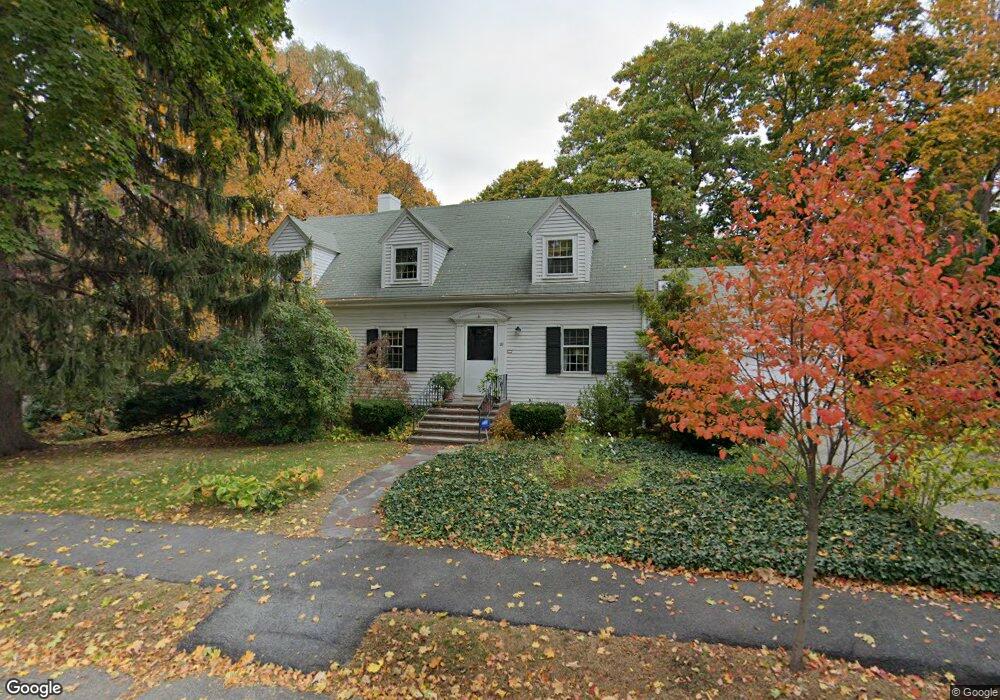
About This Home
This home is located at 20 Buswell Park, Newton, MA 02458 and is currently estimated at $1,480,758, approximately $959 per square foot. 20 Buswell Park is a home located in Middlesex County with nearby schools including Underwood Elementary School, Bigelow Middle School, and Newton North High School.
Ownership History
Date
Name
Owned For
Owner Type
Purchase Details
Closed on
Jul 22, 1994
Sold by
Merrill Eliz L Ret
Bought by
Jacobs Irving A and Jacobs Gila K
Current Estimated Value
Home Financials for this Owner
Home Financials are based on the most recent Mortgage that was taken out on this home.
Original Mortgage
$155,000
Interest Rate
8.19%
Mortgage Type
Purchase Money Mortgage
Create a Home Valuation Report for This Property
The Home Valuation Report is an in-depth analysis detailing your home's value as well as a comparison with similar homes in the area
Home Values in the Area
Average Home Value in this Area
Purchase History
| Date | Buyer | Sale Price | Title Company |
|---|---|---|---|
| Jacobs Irving A | $282,000 | -- |
Source: Public Records
Mortgage History
| Date | Status | Borrower | Loan Amount |
|---|---|---|---|
| Open | Jacobs Irving A | $146,000 | |
| Closed | Jacobs Irving A | $155,000 |
Source: Public Records
Tax History Compared to Growth
Tax History
| Year | Tax Paid | Tax Assessment Tax Assessment Total Assessment is a certain percentage of the fair market value that is determined by local assessors to be the total taxable value of land and additions on the property. | Land | Improvement |
|---|---|---|---|---|
| 2025 | $10,578 | $1,079,400 | $0 | $0 |
| 2024 | $10,228 | $0 | $0 | $0 |
| 2023 | $9,577 | $940,800 | $859,100 | $81,700 |
| 2022 | $9,164 | $871,100 | $795,500 | $75,600 |
| 2021 | $8,843 | $821,800 | $750,500 | $71,300 |
| 2020 | $8,580 | $821,800 | $750,500 | $71,300 |
| 2019 | $8,338 | $797,900 | $728,600 | $69,300 |
| 2018 | $7,939 | $733,700 | $659,200 | $74,500 |
| 2017 | $7,697 | $692,200 | $621,900 | $70,300 |
| 2016 | $7,362 | $646,900 | $581,200 | $65,700 |
| 2015 | $7,019 | $604,600 | $543,200 | $61,400 |
Source: Public Records
Map
Nearby Homes
- 548 Centre St Unit 5
- 642 Centre St
- 59 Hyde Ave
- 35 George St Unit 35
- 37 George St Unit 37
- 206 Franklin St
- 686 Centre St
- 68 Vernon St
- 12 Richardson St Unit 14
- 14 Summit St
- 9 Baldwin St Unit 15C
- 106 Farlow Rd
- 65-67 Saint James Cir
- 159 Washington St Unit 4
- 34 Channing St Unit 1
- 34 Channing St Unit 2
- 180 Hunnewell Ave Unit 180
- 70 Washington St Unit 70
- 70 Washington St
- 1 Channing St
- 28 Buswell Park
- 14 Buswell Park
- 15 Buswell Park
- 23 Buswell Park
- 300 Franklin St
- 292 Franklin St
- 306 Franklin St
- 36 Buswell Park
- 7A Buswell Park Unit A
- 7A Buswell Park Unit 7A
- 7 Buswell Park Unit 7A
- 7 Buswell Park
- 7 Buswell Park Unit 2
- 7 Buswell Park Unit 7
- 584 Centre St
- 284 Franklin St
- 602 Centre St
- 27 Buswell Park
- 35 Buswell Park
- 578 Centre St