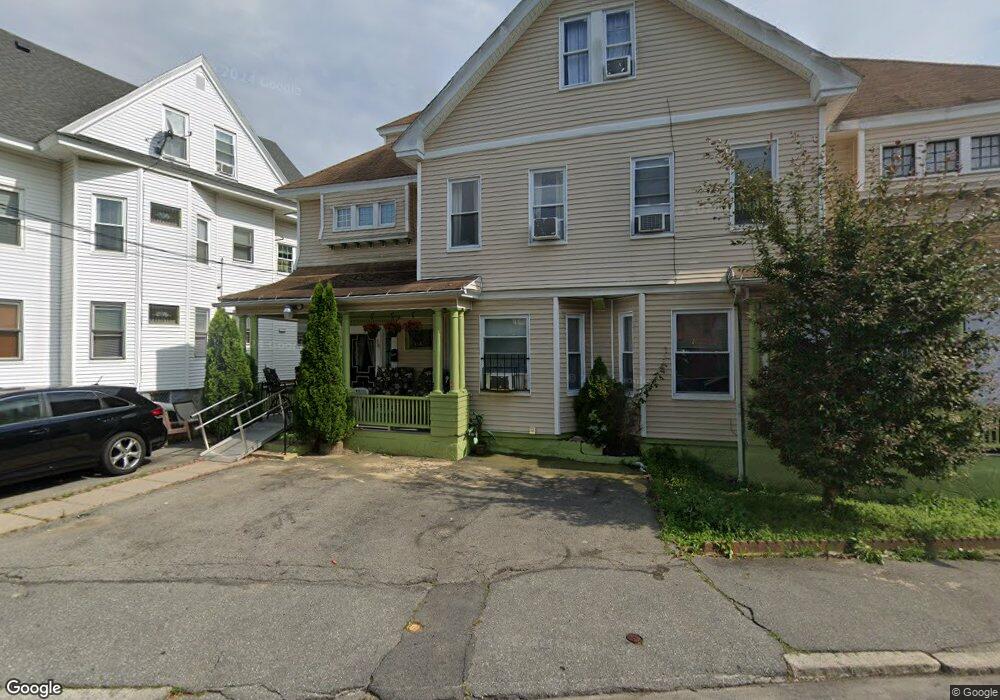
20 Buswell St Unit 22 Lawrence, MA 01841
Arlington NeighborhoodEstimated Value: $863,000 - $908,000
6
Beds
3
Baths
4,407
Sq Ft
$201/Sq Ft
Est. Value
About This Home
This home is located at 20 Buswell St Unit 22, Lawrence, MA 01841 and is currently estimated at $887,667, approximately $201 per square foot. 20 Buswell St Unit 22 is a home located in Essex County with nearby schools including School For Exceptional Studies and Central Catholic High School.
Ownership History
Date
Name
Owned For
Owner Type
Purchase Details
Closed on
Feb 28, 2020
Sold by
Jaquez Ysidra and Delacruz Jose F
Bought by
Delacruz Jose
Current Estimated Value
Home Financials for this Owner
Home Financials are based on the most recent Mortgage that was taken out on this home.
Original Mortgage
$152,000
Outstanding Balance
$72,423
Interest Rate
3.5%
Mortgage Type
New Conventional
Estimated Equity
$815,244
Purchase Details
Closed on
Dec 8, 2006
Sold by
Jaquez Ysidra
Bought by
Jaquez Ysidra and Delacruz Jose F
Purchase Details
Closed on
Aug 5, 2004
Sold by
Jaquez Ysidra and De La-Cruz Jose
Bought by
Jaquez Ysidra
Home Financials for this Owner
Home Financials are based on the most recent Mortgage that was taken out on this home.
Original Mortgage
$193,000
Interest Rate
6.2%
Purchase Details
Closed on
Oct 13, 1994
Sold by
Garvey Rosemary W
Bought by
Jaquez Ysidra
Create a Home Valuation Report for This Property
The Home Valuation Report is an in-depth analysis detailing your home's value as well as a comparison with similar homes in the area
Home Values in the Area
Average Home Value in this Area
Purchase History
| Date | Buyer | Sale Price | Title Company |
|---|---|---|---|
| Delacruz Jose | -- | None Available | |
| Jaquez Ysidra | -- | -- | |
| Jaquez Ysidra | -- | -- | |
| Jaquez Ysidra | -- | -- | |
| Jaquez Ysidra | -- | -- | |
| Jaquez Ysidra | $74,000 | -- |
Source: Public Records
Mortgage History
| Date | Status | Borrower | Loan Amount |
|---|---|---|---|
| Open | Delacruz Jose | $152,000 | |
| Previous Owner | Jaquez Ysidra | $193,000 | |
| Previous Owner | Jaquez Ysidra | $140,000 |
Source: Public Records
Tax History Compared to Growth
Tax History
| Year | Tax Paid | Tax Assessment Tax Assessment Total Assessment is a certain percentage of the fair market value that is determined by local assessors to be the total taxable value of land and additions on the property. | Land | Improvement |
|---|---|---|---|---|
| 2025 | $6,800 | $772,700 | $102,500 | $670,200 |
| 2024 | $6,711 | $725,500 | $107,700 | $617,800 |
| 2023 | $6,748 | $664,200 | $103,900 | $560,300 |
| 2022 | $6,543 | $571,900 | $98,000 | $473,900 |
| 2021 | $6,135 | $500,000 | $98,000 | $402,000 |
| 2020 | $5,408 | $435,100 | $81,700 | $353,400 |
| 2019 | $6,172 | $451,200 | $60,700 | $390,500 |
| 2018 | $6,119 | $427,300 | $55,000 | $372,300 |
| 2017 | $5,713 | $372,400 | $52,100 | $320,300 |
| 2016 | $5,425 | $349,800 | $40,700 | $309,100 |
| 2015 | $5,197 | $343,700 | $40,700 | $303,000 |
Source: Public Records
Map
Nearby Homes
- 129-131 Lexington St
- 24 Bennington St
- 131A Lawrence St Unit 40
- 169 Berkeley St
- 20 Knox St Unit 43
- 20 Knox St Unit 23
- 100-102 E Haverhill St
- 32 Alma St Unit 32
- 183 Berkeley St
- 434-438 Hampshire St
- 192 Union St
- 6 Longwood Dr
- 5 Arlington Terrace
- 65 Brook St
- 27 Exchange St
- 7 Magnolia Rd
- 29 Willow St Unit B
- 364 Lawrence St
- 35 Kendall St
- 2 Lawrence St
- 18 Buswell St
- 65 Thorndike St Unit 67
- 52 Monmouth St Unit 2
- 52 Monmouth St
- 50 Monmouth St
- 9 Buswell St Unit 11
- 61-63 Thorndike St
- 61 Thorndike St Unit 63
- 24 Buswell St Unit 26
- 14 Buswell St Unit 16
- 15 Buswell St
- 68 Thorndike St
- 10 Buswell St
- 4 Allyn Terrace
- 28 Buswell St
- 28 Buswell St Unit 2
- 101 Knox St
- 49 Eutaw St
- 49 Eutaw St
- 42 Monmouth St Unit 48