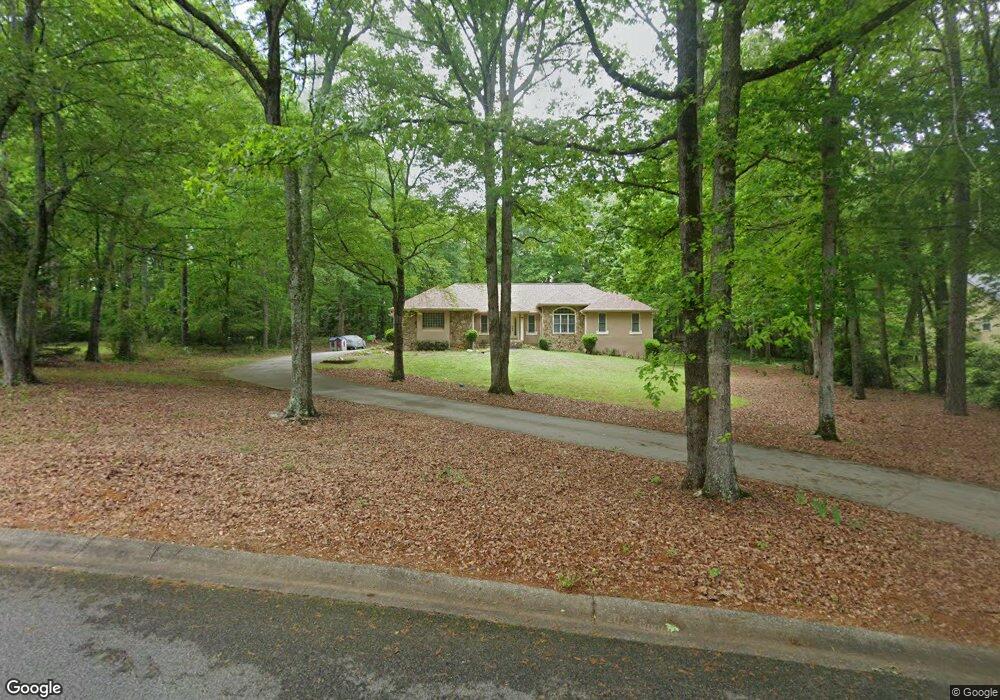
20 Cannongate Trace Sharpsburg, GA 30277
Estimated Value: $472,211 - $607,000
3
Beds
3
Baths
2,349
Sq Ft
$237/Sq Ft
Est. Value
About This Home
This home is located at 20 Cannongate Trace, Sharpsburg, GA 30277 and is currently estimated at $557,303, approximately $237 per square foot. 20 Cannongate Trace is a home located in Coweta County with nearby schools including Canongate Elementary School, Madras Middle School, and Northgate High School.
Ownership History
Date
Name
Owned For
Owner Type
Purchase Details
Closed on
Aug 7, 2014
Sold by
Aulls Shirley A
Bought by
Edens Kirk Wade
Current Estimated Value
Home Financials for this Owner
Home Financials are based on the most recent Mortgage that was taken out on this home.
Original Mortgage
$221,600
Outstanding Balance
$167,004
Interest Rate
3.88%
Mortgage Type
New Conventional
Estimated Equity
$390,299
Purchase Details
Closed on
Dec 18, 2001
Sold by
Bob Adams Homes Inc
Bought by
Taylor John E and Taylor Cyhthia J
Home Financials for this Owner
Home Financials are based on the most recent Mortgage that was taken out on this home.
Original Mortgage
$73,950
Interest Rate
6.42%
Mortgage Type
New Conventional
Purchase Details
Closed on
Mar 8, 1994
Bought by
Aulls Shirley A
Purchase Details
Closed on
Mar 6, 1992
Bought by
Thompson Joseph H
Purchase Details
Closed on
Mar 28, 1989
Bought by
Crane Michael R
Create a Home Valuation Report for This Property
The Home Valuation Report is an in-depth analysis detailing your home's value as well as a comparison with similar homes in the area
Home Values in the Area
Average Home Value in this Area
Purchase History
| Date | Buyer | Sale Price | Title Company |
|---|---|---|---|
| Edens Kirk Wade | $277,000 | -- | |
| Taylor John E | $253,900 | -- | |
| Aulls Shirley A | -- | -- | |
| Thompson Joseph H | $160,000 | -- | |
| Crane Michael R | $22,500 | -- |
Source: Public Records
Mortgage History
| Date | Status | Borrower | Loan Amount |
|---|---|---|---|
| Open | Edens Kirk Wade | $221,600 | |
| Previous Owner | Taylor John E | $73,950 |
Source: Public Records
Tax History Compared to Growth
Tax History
| Year | Tax Paid | Tax Assessment Tax Assessment Total Assessment is a certain percentage of the fair market value that is determined by local assessors to be the total taxable value of land and additions on the property. | Land | Improvement |
|---|---|---|---|---|
| 2025 | $4,008 | $177,246 | $32,000 | $145,246 |
| 2024 | $3,830 | $169,570 | $32,000 | $137,570 |
| 2023 | $3,830 | $168,977 | $28,000 | $140,977 |
| 2022 | $3,318 | $153,994 | $28,000 | $125,994 |
| 2021 | $3,572 | $140,368 | $20,000 | $120,368 |
| 2020 | $3,639 | $167,116 | $20,000 | $147,116 |
| 2019 | $3,165 | $112,946 | $20,000 | $92,946 |
| 2018 | $3,172 | $112,946 | $20,000 | $92,946 |
| 2017 | $3,002 | $107,188 | $20,000 | $87,188 |
| 2016 | $2,920 | $105,543 | $20,000 | $85,543 |
| 2015 | $2,873 | $105,543 | $20,000 | $85,543 |
| 2014 | $1,268 | $88,068 | $10,000 | $78,068 |
Source: Public Records
Map
Nearby Homes
- 35 Palmer Place
- 9 Warrior Way
- 56 Hudgen Rd
- 518 Palmetto Tyrone Rd
- 291 Cannongate Rd
- 0 Fischer Spur Rd Unit 10495301
- 40 Joe Lee Dr
- 30 Joe Lee Dr
- 20 Skipton Ct
- 27 Dorian Ct
- 70 N Strathmore Dr
- 50 Big Oaks Ct
- 32 Riverbirch Way
- 78 Rosebay Ln
- 40 Wenham Ln
- 10 Monteray Ct
- 127 Northgate Preserve Dr
- 46 I W Brooks Rd
- 259 Strathmore Dr Unit 3
- 5588 Highway 29 N
- 30 Cannongate Trace
- 10 Cannongate Trace
- 20 Lawn Market
- 25 Cannongate Trace
- 40 Cannongate Trace
- 40 Cannongate Trace Unit A-9
- 734 Palmetto Tyrone Rd
- 6 Cannongate Trace
- 45 Cannongate Trace
- 50 Cannongate Trace
- 15 Lawn Market
- 2 Cannongate Trace
- 5 Cannongate Trace
- 11 Cannongate Trace
- 15 Bobby Jones Cir
- 774 Palmetto Tyrone Rd
- 30 Lawn Market
- 698 Palmetto Tyrone Rd
- 60 Cannongate Trace
- 25 Lawn Market